
 Exchange Ranking
 Top Exchanges
 24h Volume Ranking
 Popularity Ranking
 Exchange BTC Balance
 Proof of Reserves
 Decentralized Exchanges
 Funding Rate
 Funding Heatmap
 Liquidation Data
 Max Pain
 Long/Short Ratio
 Whale L/S Ratio
 Binance/Okex/Huobi L/S
 Bitfinex Margin L/S
 ETF Tracker
 Solana ETF
 XRP ETF
 Hong Kong ETF
 Bitcoin Treasuries
 Crypto Reversal
 Ethereum Reserves
 HyperLiquid Wallet Analysis
 Hyperliquid Whale Watch
 Large Transactions
 On-chain Movement
 Bitcoin ROI
 Stablecoin Market Cap
 Options Analysis
 News
News Articles
 Economic Calendar
 Features
 Wallet
 Contract Calculator


 Security
 Collections
 Watchlist
 Following
 BTC
BTC  ETH
ETH  SHIB
SHIB Current Price and Recent Performance of $SHIB
The current trading price of $SHIB is approximately US$0.00004603, down 1.8% during the day and 13.18% during the week. This correction is crucial for investors trying to gauge the future outlook. According to the August 2026 Shiba Inu price forecast, its price range is roughly between the low of US$0.0000405 and the high of US$0.0000710. The final result depends largely on the price's performance at the current support level. One point needs to be pointed out in advance: the top 100 wallets control 83.05% of the total supply. It should be noted that this article is only based on charts and data for analysis and does not constitute buying and selling suggestions.
Today's Shiba Inu Price: Real-time Data and 24-Hour Changes
At US$0.00004603,$SHIB has given up most of its recent gains-down 1.8% today and 13.18% in the past week. The current market value is approximately US$2.714 billion, the circulation supply is 589.24 trillion pieces, and the fully diluted value is US$4.606 billion. This is the starting point for this Shiba Inu price forecast in August 2026.
Indicators| Value
Price| $0.000004603
24-hour change|-1.8%
7-day change|-13.18%
Market Value| $2.714 billion
Fully diluted valuation| $4.606 billion
Circulation Supply| 589.24 trillion SHIB
total supply| 589.497 trillion SHIB
24-hour trading volume| $112.18 million
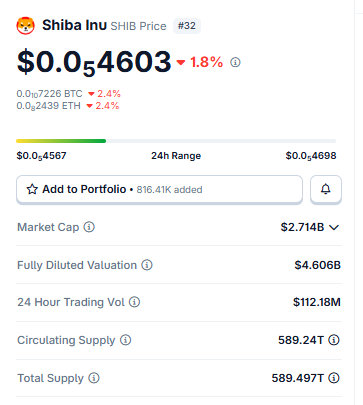
Source: The market value data of Shiba Inu coins is taken from Coingecko, with data as of July 29, 2026. Data from different tracking sites may vary slightly.
Factors that may affect prices in August
The concentration of holders of Shiba Inu coins is the key story behind this August 2026 price forecast. The top 100 wallets hold 83.05% of the supply; if we further focus on whale wallets (accounting for only 0.04% of all holders), the share they control among themselves will reach as high as 94.57%. 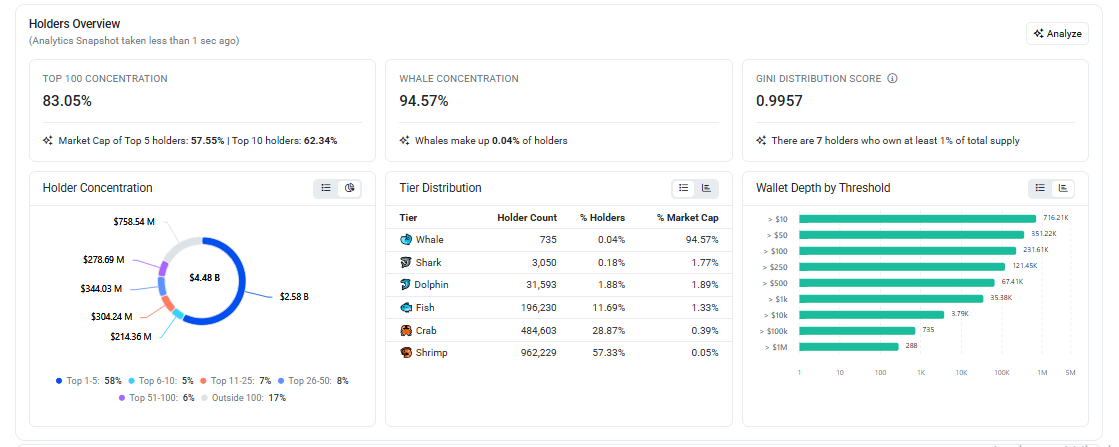
Source: Holder data is taken from Etherscan.
This extreme concentration means that a few addresses are enough to push prices significantly in either direction with little influence from retail trading behavior. The broader flow of cryptocurrency funds is also important. Rising dominance of Bitcoin tends to suck liquidity out of altcoins such as SHIB, while declining dominance usually frees up funds and flows back into meme coins. Since the liquidity of SHIB mainly runs through Ethereum trading pairs, the violent fluctuations of Ethereum often drive SHIB to fluctuate together.
Chart interpretation: Support and resistance
Looking at the weekly chart narrowed,$SHIB is currently in a downward channel, with current prices trading around $0.0000461. If the upper boundary of the channel is breached driven by real volume, the price will first open the path to US$0.0000710, followed by US$0.0001012. If momentum continues, the expansion target is US$0.0001245. 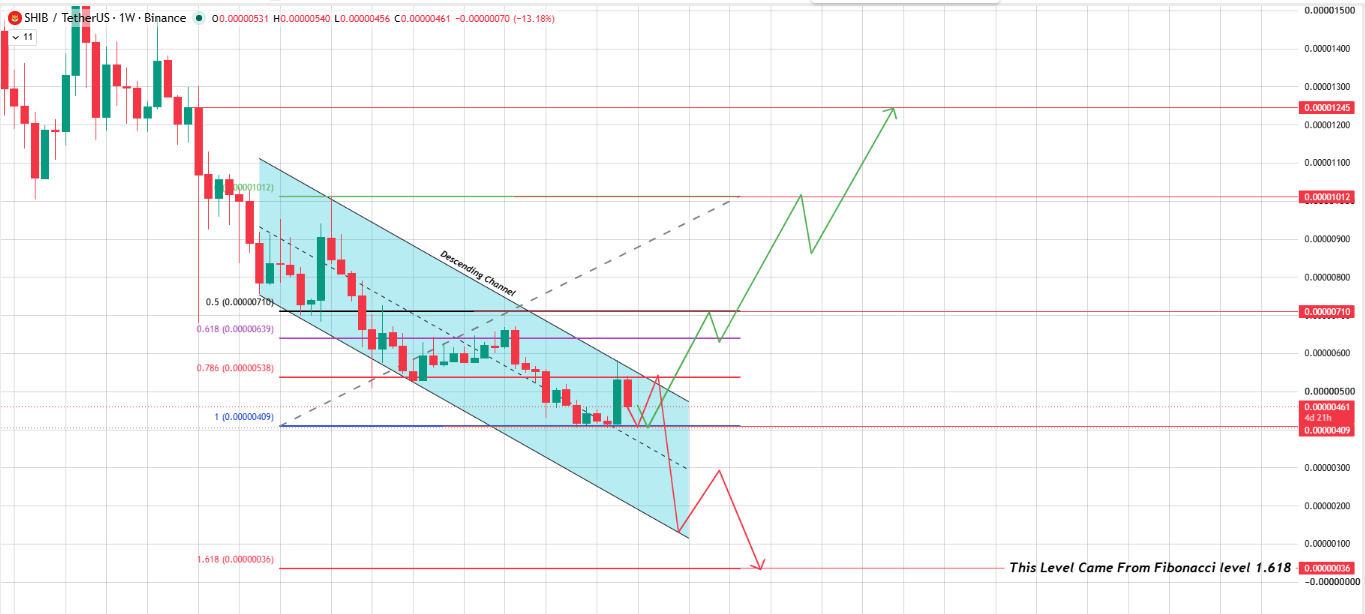
Source: Weekly chart is taken from TradingView.
But if such a breakthrough fails to stand firm, prices tend to fall back into the channel and retest these same support levels; if the channel breaks downward instead, the extended downward support level is US$0.00000036. Therefore, the confirmation signal is more important than the initial breakthrough trend. Weekly Fibonacci levels are consistent with this structure. Callbacks are at $0.0000710 (0.5),$0.0000639 (0.618),$0.0000538 (0.786) and $0.0000409 (1), while the extension target of $0.0000036 comes from the 1.618 extension. Currently, the price is at $0.0000461, which is between the 0.786 level ($0.0000538) and the 1 level ($0.0000409). This area is essentially the same as the demand range mentioned above and is an area where bulls need to defend to maintain recovery prospects.
August 2026 Shiba Inu Price Forecast: Daily Chart Analysis
On the daily chart, prices have been consolidating before the volume breakthrough, and are currently retracing to test the breakthrough area and cover the fair value gap (FVG) left by the rising process.
Source: Daily chart taken from TradingView.
Whether the gap can be filled and whether buyers will re-enter with volume will determine the next stage of the trend: if volume occurs here, the price should move back towards the upper resistance level; if not, the price may fall back to support. Another point worth noting in the clearing data: long positions are concentrated around $0.0000531, so a break through this level could trigger a wave of short covering. Below US$0.0000405, the clearing cluster thickens again, meaning a break below that level could trigger a rapid and sharp decline. Even more encouraging is that exchange volume this week has gradually shrunk on declining days and increased on rising days, suggesting that seller power near support levels may be drying up.
August's bullish, neutral and bearish scenarios
all come down to a fairly narrow demand range: US$0.0000456 to US$0.00000461. The direction in which prices break through the region basically determines the price prospects of Shiba Inu coins in August 2026.
Scenario| August 2026 target price| Failure conditions
bullish| $0.00000583 – $0.00000663 |Daily closing price below $0.00000456
Neutral| $0.0000405-$0.0000531 (range oscillation)| Confirm that closing price exceeds either boundary
Bear| $0.00000405 – $0.00000370 |Break below and stand firm below $0.0000370
For bulls to take the lead, they need to first recover $0.0000531 and then hit $0.0000583 driven by real volume. To be honest, neutral scenarios are less exciting and more organized horizontally within the current area. And if $0.00000405 fails to hold, bears will prevail, opening the door to a fall to the next support level (around $0.0000370).
What the charts imply
Currently, most chart-based interpretations of SHIB point to a "wait and see" pattern rather than an obvious trend. The weekly channel has been compressed to a very narrow range. Once this squeeze finally breaks through, it often triggers violent fluctuations. As long as the US$0.0000405 to US$0.0000456 area is held, market sentiment can remain cautiously optimistic, but once the bottom falls, the sentiment will quickly turn bearish. It's worth remembering that once $SHIB starts to act, it tends to go too high on both bullish and bearish targets.
The above is not personalized financial advice, but is based on analysis based on charts and on-chain data. The cryptocurrency market is highly volatile, prices may jump through various levels without warning, and past patterns cannot guarantee future performance. Please do your own research and consider consulting a licensed financial adviser before investing money.
Looking further: 2027 to 2030
If the $0.0000405 region can hold for the rest of 2026, then a slow recovery to the $0.0000710 to $0.0001012 region in 2027 and 2028 seems feasible based on historical chart performance. A downward breakthrough will obviously delay this timetable.$ Where SHIB ends up in 2030 depends not so much on any chart pattern as on adoption, exchange liquidity, and whether the project can survive several more market cycles.
The single biggest risk that could break this forecast
is that concentration data. Whale wallets hold 94.57% of supply, and as long as a few of them sell simultaneously, it will be enough to break through support faster than the chart suggests. If $SHIB does fall below US$0.0000370, it will open up deeper downside, and the extended Fibonacci level near US$0.0000036 will serve as the bottom of tail risk, but this scenario requires near-complete collapse conditions, far beyond the neutral scenario. On the other hand, a return to meme (often triggered by the decline in Bitcoin's dominance) could easily push the target above the upper limit of a bullish scenario.
Secure Purchase and Storage SHIB
SHIB can be purchased on most major exchanges and is usually paired with USDT, USD and BTC. Given the low unit price of SHIB, it is wise to choose an exchange with sufficient liquidity to avoid unnecessary slippage. For larger positions, a hardware wallet is a reasonable choice; for smaller, more active positions, a software wallet is fine. Given the concentration data above, it may be a good idea to carefully control position sizes regardless of your outlook.
Glossary
Support area: Essentially a price area where buyers had previously appeared and slowed down the decline. The resistance zone, on the other hand, is a position that has suppressed rebounds in the past. When you hear someone mention trend lines, they are simply referring to the sloping straight lines on the chart that connect a series of higher lows. Holder concentration: refers to the proportion of supply stored in a relatively small number of wallets; the higher this figure, the greater the impact on the market if these addresses decide to sell collectively. Bitcoin dominance: Bitcoin's share of the total market value of cryptocurrencies, which traders view as a rough measure of altcoins 'risk appetite. The last one: Ethereum correlation, which describes how closely the SHIB price moves in sync with the Ethereum price, which makes sense because most of the SHIB's liquidity actually runs through Ethereum trading pairs.
Theory of Law
This forecast is based on weekly and daily chart data at the time of writing, exchange volume trends, and wallet level holder concentration data. Each price level here is directly derived from the support, resistance and Fibonacci structure of the chart, and no inferences are made beyond this range. This article is for reference only and does not constitute financial advice.
Disclaimer : This August 2026 Shiba Inu price forecast is for information and educational purposes only and should not be regarded as financial or investment advice. The cryptocurrency market is extremely volatile and prices can change rapidly. Before making any investment decisions, be sure to research and consult a qualified financial adviser.






















