
 Exchange Ranking
 Top Exchanges
 24h Volume Ranking
 Popularity Ranking
 Exchange BTC Balance
 Proof of Reserves
 Decentralized Exchanges
 Funding Rate
 Funding Heatmap
 Liquidation Data
 Max Pain
 Long/Short Ratio
 Whale L/S Ratio
 Binance/Okex/Huobi L/S
 Bitfinex Margin L/S
 ETF Tracker
 Solana ETF
 XRP ETF
 Hong Kong ETF
 Bitcoin Treasuries
 Crypto Reversal
 Ethereum Reserves
 HyperLiquid Wallet Analysis
 Hyperliquid Whale Watch
 Large Transactions
 On-chain Movement
 Bitcoin ROI
 Stablecoin Market Cap
 Options Analysis
 News
News Articles
 Economic Calendar
 Features
 Wallet
 Contract Calculator


 Security
 Collections
 Watchlist
 Following
 DOGE
DOGE Dogecoin approaches key resistance area, traders wait for daily close confirmation
Dogecoin is approaching a decisive resistance area, and traders are waiting for daily close confirmation to verify the broader bullish structure. Improvements in momentum indicators and channel breakthroughs have provided support for price recovery, but resistance remains a technical challenge currently facing the market.
After weeks of selling, the consolidation has put Dogecoin near a critical level that may determine the direction of its next trend.
The breakthrough of dogcoin remains the focus of market attention, and technical conditions continue to improve. After a long period of consolidation, market participants are paying close attention to confirmation signals, while momentum is also building.
Resistance becomes the top concern
CJ shared a simple but rigorous trading observation in recent market updates. He mentioned that "the party will not start" until it is confirmed above the resistance level. This view emphasizes the importance of verification rather than prediction. 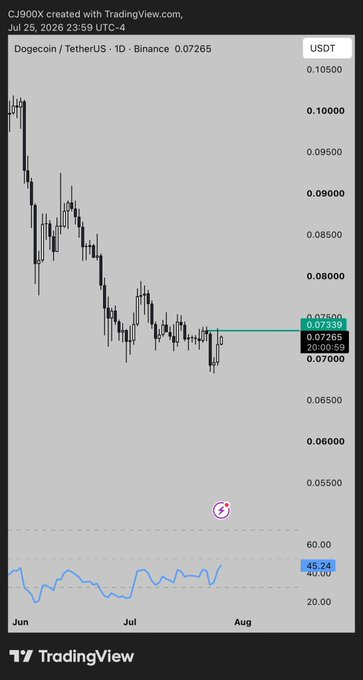
The daily chart shows that US$0.07339 is the key resistance level. Previous attempts to rebound have been blocked below this level. Repeated rejections further strengthened the technical importance of this resistance level throughout July.
Broader trends still reflect a recovery from previous declines. June saw a sustained series of lower highs and lows. As volatility has declined in recent weeks, selling pressure has gradually subsided.
Prices are currently trading around $0.07316, just below this key resistance level. This location puts buyers just one step away from confirmation. If the daily line can decisively close above the resistance level, it will improve the broader technical structure.
Momentum indicators support recovery attempts
The four-hour chart presents a more constructive short-term picture. Buyers recently broke through the downward channel that guided the latest round of corrections. This breakthrough interrupted a previous series of lower highs. 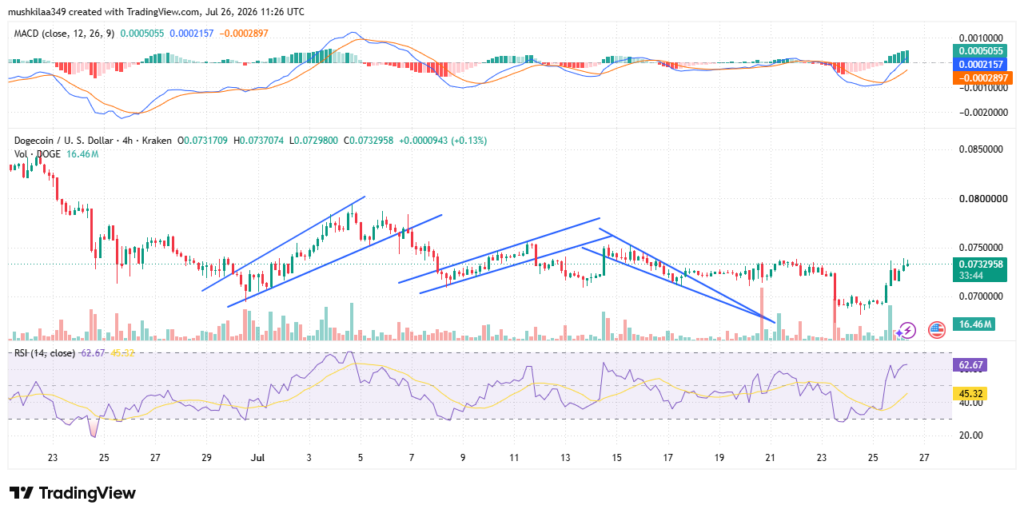
In the lower time frame, CJ's resistance judgment is improving, while short-term resistance has now risen to higher levels. The MACD indicator forms a golden cross above its signal line. The expanding positive bar chart shows that buying pressure is increasing.
The relative strength indicator also reflects improving market conditions. The indicator has climbed above the neutral mid-line after recent gains. Momentum is currently biased towards buyers, but has not yet entered overbought territory.
Trading volumes have strengthened during the recent recovery phase. The increase in participation supports the trend of prices breaking through the downward resistance line. This improvement provides additional confidence in recent breakthrough attempts.
Confirmation is still the decisive factor
Despite the increased momentum, the resistance level has not yet been fully breached. Past band highs still represent potential selling pressure. Buyers still need to wait for confirmation signals before taking control of the situation.
The daily close highlighted by CJ is precisely to deal with the risk of false breakthroughs. Intraday breakthroughs in resistance often reverse before the close. Waiting for confirmation can reduce risk exposure due to temporary fluctuations.
The narrowed trading range is also worthy of attention. After experiencing a large downward trend, consolidation usually occurs before a larger market unfolds. Such periods often indicate that the trend will expand again after the equilibrium is broken.
The current technical situation seems to be stronger than in previous weeks. Momentum indicators have improved and prices have stabilized below resistance. Even so, only a confirmation of a daily close above $0.07339 can turn the current recovery into a technically proven bullish breakthrough.






















