Exchange Ranking
 Top Exchanges
 24h Volume Ranking
 Popularity Ranking
 Exchange BTC Balance
 Proof of Reserves
 Decentralized Exchanges
 Funding Rate
 Funding Heatmap
 Liquidation Data
 Max Pain
 Long/Short Ratio
 Whale L/S Ratio
 Binance/Okex/Huobi L/S
 Bitfinex Margin L/S
 ETF Tracker
 Solana ETF
 XRP ETF
 Hong Kong ETF
 Bitcoin Treasuries
 Crypto Reversal
 Ethereum Reserves
 HyperLiquid Wallet Analysis
 Hyperliquid Whale Watch
 Large Transactions
 On-chain Movement
 Bitcoin ROI
 Stablecoin Market Cap
 Options Analysis
 News
News Articles
 Economic Calendar
 Features
 Wallet
 Contract Calculator


 Security
 Collections
 Watchlist
 Following
 BTC
BTC  ETH
ETH  XRP
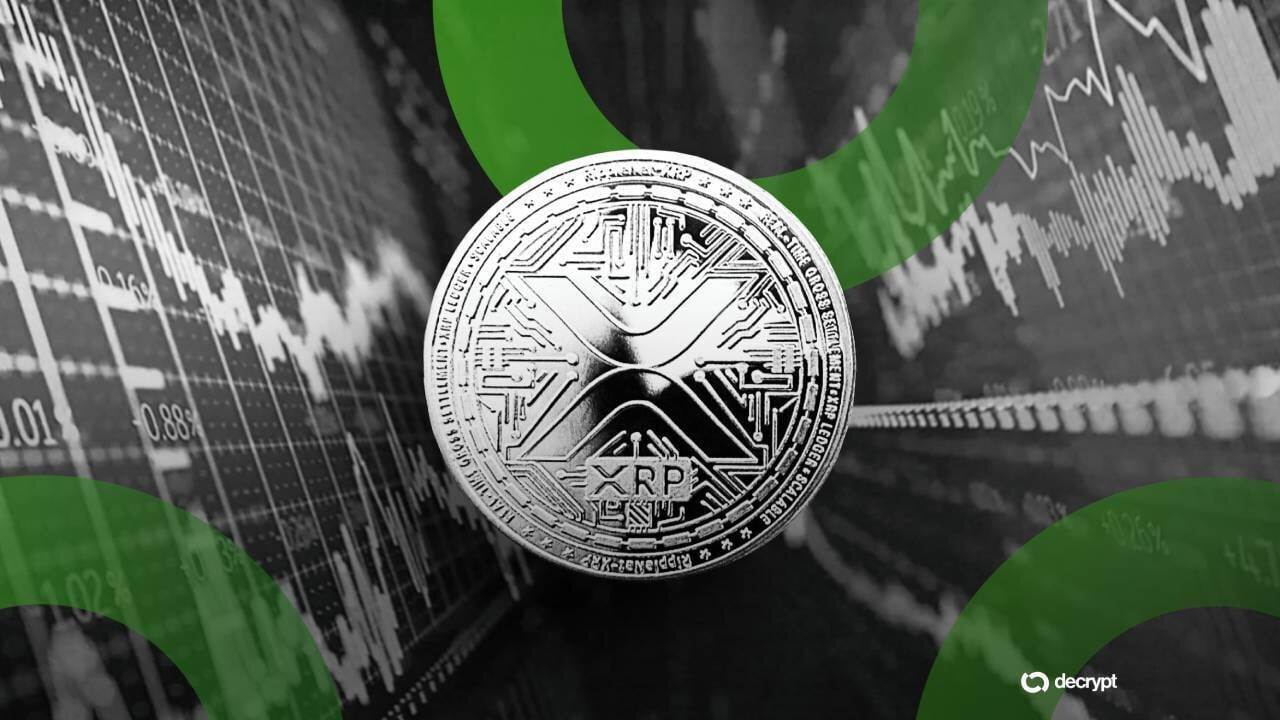
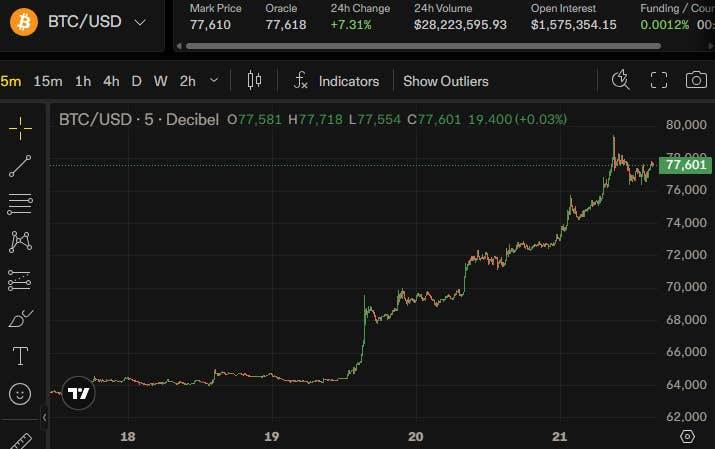
XRP Cryptocurrency is having its best week in months, and XRP has just taken the wheel. Bitcoin broke through $72,000 this week, driven by a record short squeeze-traders betting on falling prices were forced to buy them back at higher prices, pushing prices even higher-a trend helped by the U.S. Treasury Department's plan to almost double the size of long-term bond repurchases starting September 9. Bitcoin trading prices were above US$77,000 today, reaching an intraday high of US$79,000. Traders dubbed the move a "streamlined version of quantitative easing" because it relaxes bond markets in the same way as past Fed stimulus programs, even though it comes from another branch of government. Risky assets rose across the board, with XRP rising the most.
On the daily chart, XRP opened at US$1.2681 on Friday, hitting an intraday high of US$1.4300. As of writing, the trading price was close to US$1.40-a single candle chart up 10.52%. 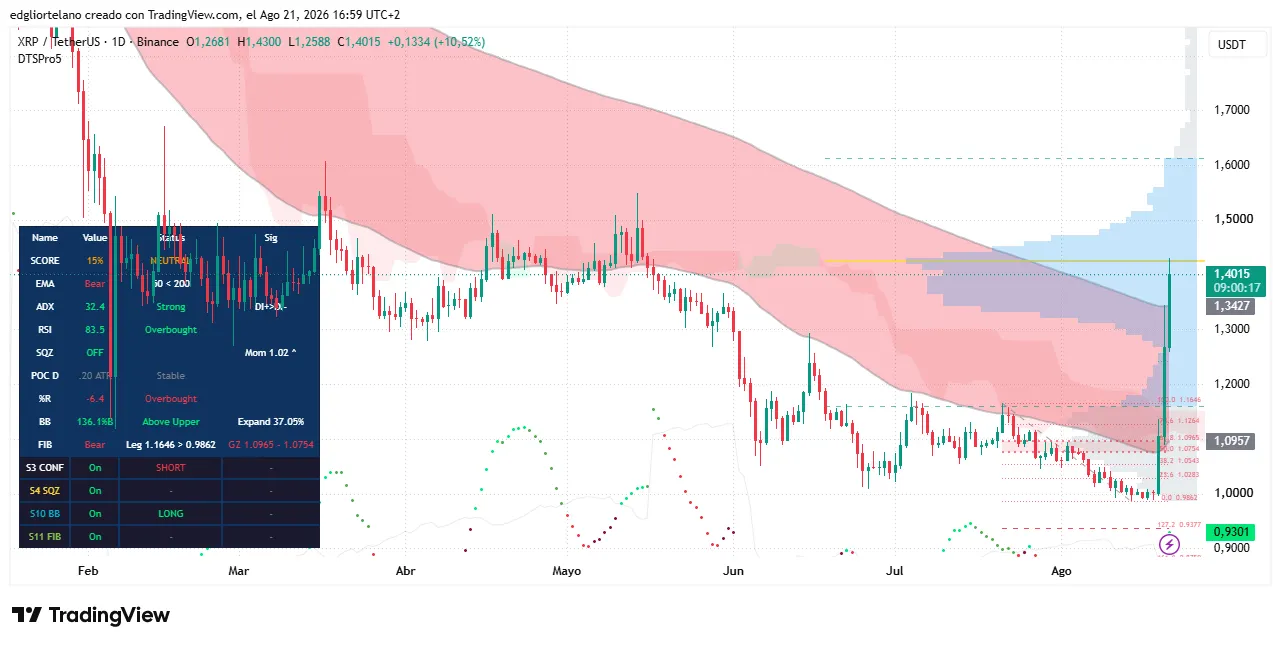 Real-time rankings showed that the broader 24-hour increase was even higher, reaching 14.21%, compared with a 40.06% increase in the past week. This makes XRP the best-performing single asset among the top ten cryptocurrencies by market value today, ahead of Bitcoin's 7.44% and Ethereum's 4.50%.
The XRP price chart has been stuck in a dead-fork pattern for months, and as bad as it sounds, it is as bad as it is. A dead fork is the pattern formed when the 50-day index moving average (short-term price trend line) falls below the 200-day moving average. This is a classic signal that traders interpret as momentum is turning bearish. Since the dead fork formed on the XRP chart, every rebound attempt has stalled at or just below the cloud-the two moving averages that form the cloud on the chart. Today's candle chart not only touched that ceiling, but also closed completely above it. This is the first time since the dead fork formed that the daily price closed above the two index moving averages. But this is not the same as a dead fork reversal. The 50-day moving average is still below the 200-day moving average-the two lines themselves have not yet re-crossed to form what traders call the golden cross. But prices return to above the two moving averages is usually the first domino, a move that must occur before the moving average itself finally follows.
Other indicator panels also support breakthrough interpretation. The Relative Strength Index (RSI) is a kinetic indicator on a scale of 0 to 100, with a value above 70 indicating an overbought condition, which is currently at 83.5-in a deeply overbought area, meaning that the trend is happening quickly enough that a pause or correction will not be surprising. The Average Trend Index (ADX), which measures the strength of a trend (regardless of direction), is currently at 32.4, significantly higher than the 25 level used by traders to confirm true trends, and the buying direction line is higher than the selling direction line. The squeeze momentum indicator (used to identify fluctuation compression before a breakthrough) has turned "off", meaning that the squeeze has been triggered and momentum is rising.
This trend does not occur in isolation. XRP's best week since the 2024 election was boosted by a short squeeze in Bitcoin, while the same Treasury liquidity news boosted $275 million in Ripple bond sales, and the U.S. Securities and Exchange Commission's (SEC) new cryptocurrency exemption rules were also included. But Bitcoin itself has not yet closed above its own dead line, which means XRP is currently ahead of the currencies it normally follows.
Key prices to watch: Resistance is at $1.43 (today's high), then $1.60, near the top of the downtrend channel that has limited XRP since late 2025. Support is at $1.34, followed by the gold area between $1.0754 and $1.0965, and deeper support is at $0.9862. The next real test is September 9, when the Treasury Department begins a larger bond buyback, and September 15, when the Senate plans to reconsider the Clarification Act.