Exchange Ranking
 Top Exchanges
 24h Volume Ranking
 Popularity Ranking
 Exchange BTC Balance
 Proof of Reserves
 Decentralized Exchanges
 Funding Rate
 Funding Heatmap
 Liquidation Data
 Max Pain
 Long/Short Ratio
 Whale L/S Ratio
 Binance/Okex/Huobi L/S
 Bitfinex Margin L/S
 ETF Tracker
 Solana ETF
 XRP ETF
 Hong Kong ETF
 Bitcoin Treasuries
 Crypto Reversal
 Ethereum Reserves
 HyperLiquid Wallet Analysis
 Hyperliquid Whale Watch
 Large Transactions
 On-chain Movement
 Bitcoin ROI
 Stablecoin Market Cap
 Options Analysis
 News
News Articles
 Economic Calendar
 Features
 Wallet
 Contract Calculator


 Security
 Collections
 Watchlist
 Following
 BTC
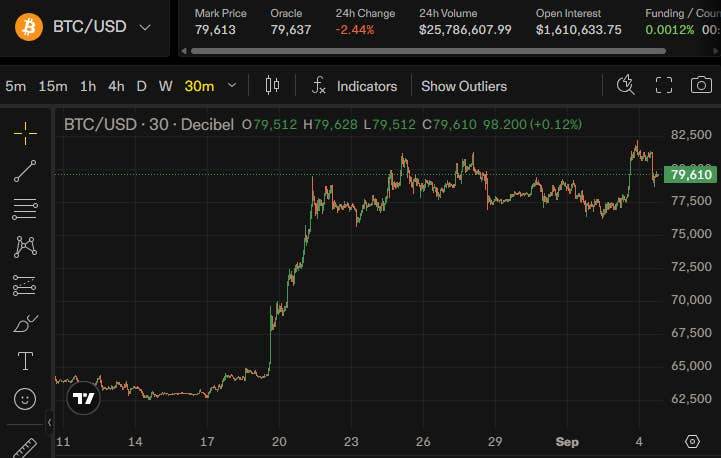
BTC Bitcoin retreated after hitting a high of $82,281, and the support level of $78,500 became a key watershed.
After Bitcoin hit a peak of $82,281 on September 4, some of the results of its rebound have been erased. Prices then fell back to around $79,000, falling nearly 4% within a few hours. Although the daily trend remains positive, short-term indicators are showing signs of weakening momentum. For now, whether support around $78,500 can be held will determine whether the decline is a temporary correction or the failure of a recent bullish breakthrough.
Quick overview of core points
- Bitcoin retreated towards the $79,000 area after hitting a high of $82,281.
- The US$78,000 support level has become a key line of defense to maintain rebound momentum.
- If the price falls below US$76,800, the price may fall back to US$74,081.
- The rally above $82,000 was driven by short squeeze, resulting in the liquidation of $250 million of short positions.
- The moving average remains bullish, but short-term momentum indicators show signs of weakness.
US$78,000 support determines the fate of Bitcoin's rebound
The decline began with Bitcoin's blocked retreat at US$82,281. Since then, prices have been pulled back to the buy-intensive area of $78,500 to $79,200. During this process, trading volume exceeded the level usually recorded on the hourly K-line in previous times. As a result, the $78,000 threshold now constitutes the buyer's main line of defense. Once this position falls, it may expose the starting range of the last rise, which is between $76,567 and $77,300.
In the following trades, the following key levels will help judge market strength:
- Immediate support: around US$78,531;
- Second barrier: US$76,800 to US$77,300 range;
- Trend improvement signals: A return above $79,420 will improve the short-term trend;
- Major resistance levels: $80,335 and $81,430;
- Bull restart signal: The daily line will close above $82,281 to reignite the rally.
According to the analysis, if the $76,800 support level is confirmed to fall below, it means that the September 3 breakout failed and Bitcoin price may fall back to the daily pivot point of $74,081.
The rally above $82,000 was partly due to short squeeze
The speed of this decline also explains the nature of the previous move. The rally above $82,000 was not driven entirely by new spot buying, but was exacerbated by the forced unwinding of large amounts of leveraged short positions.
Data showed that nearly US$250 million of short Bitcoin positions were liquidated in just one day, compared with only US$21.5 million of long positions. Across the entire cryptocurrency market, the total clearing amount is approximately US$758 million, of which US$480 million was cleared for short bets.
Short squeeze can trigger very rapid price increases. Sellers forced to close their positions must buy assets to close their positions, which increases demand in the short term. However, if new buyers fail to take over, the market may lose momentum once these covering operations are completed. So a decline that started at $82,281 does not necessarily mean the end of the entire rally, but it suggests that the market has failed to consolidate gains by liquidating profits.
The moving average remains optimistic, contrasting with momentum indicators
The trend at the daily level is stronger than the fluctuations on the hourly chart. As a result, Bitcoin remains above most of its exponential moving averages and simple moving averages. Fourteen of the fifteen trend indicators still send bullish signals. This shows that buyers still have an advantage on the overall trend. However, this observation depends on whether prices can recover $79,420,$80,335 and $81,430, respectively.
The oscillator sends a more cautious signal. The Relative Strength Index (RSI) hovers around 66 and is at neutral, while both MACD and momentum indicators give bearish signals. Overall, nine oscillators are neutral, two are bearish, and there are no bullish signals.
This difference suggests that the overall structure of gains remains intact, but the immediate momentum is weakening. Sellers dominated for a very short period of time, but have not yet controlled the daily trend.
If it can hold on to $78,000 strongly, Bitcoin is expected to rebound to $80,300 and then test $81,400. Conversely, if the closing price is below $76,800, the risk of a return to $74,081 will increase, which will lead to a further decline of nearly 6% from the first support level.