Exchange Ranking
 Top Exchanges
 24h Volume Ranking
 Popularity Ranking
 Exchange BTC Balance
 Proof of Reserves
 Decentralized Exchanges
 Funding Rate
 Funding Heatmap
 Liquidation Data
 Max Pain
 Long/Short Ratio
 Whale L/S Ratio
 Binance/Okex/Huobi L/S
 Bitfinex Margin L/S
 ETF Tracker
 Solana ETF
 XRP ETF
 Hong Kong ETF
 Bitcoin Treasuries
 Crypto Reversal
 Ethereum Reserves
 HyperLiquid Wallet Analysis
 Hyperliquid Whale Watch
 Large Transactions
 On-chain Movement
 Bitcoin ROI
 Stablecoin Market Cap
 Options Analysis
 News
News Articles
 Economic Calendar
 Features
 Wallet
 Contract Calculator


 Security
 Collections
 Watchlist
 Following
 XRP
XRP XRP continues to consolidate in the downward channel, with the lower boundary becoming the key to the market's next technical test.
Market positioning rose sharply in August, with Binance leading XRP's open interest, trading volume and futures activity on listed exchanges. Prices need to gain support near the bottom of the channel, and once this support level is decisively broken, the blue line in the chart will become a key technical indicator.
XRP is still consolidating after experiencing a strong breakthrough. Prices are testing a downward channel, and traders are closely watching support below the latest range.
Markets return to consolidation mode
The views released by Jesse Olson place XRP in a recurring sequence of cryptocurrency markets. This sequence describes the process of "consolidation-pull-up-consolidation again-potential backtest". This logic clearly places the current chart shape into another round of revision.
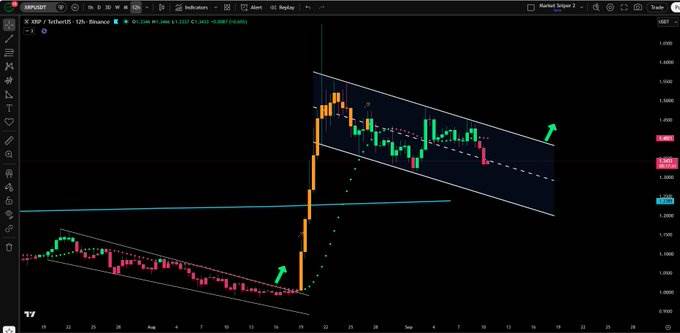
Early charts showed prices falling within a broader downward structure. XRP eventually touched the lower boundary of the channel, and buyers then reacted strongly. This rebound contributed to the vertical upward trend visible in subsequent charts.
This breakthrough broke through the previous downward structure with strong force, pushing XRP prices from around US$1.00 to a region close to US$1.50. After that, the price increase stopped and began to form another downward channel.
The current structure creates multiple lower highs below the upper trend line. At the same time, the lower border provides buyers with the closest technical support area. This makes the bottom of the channel the core of the current market structure.
Channel support becomes the main test point
The latest chart shows that prices are moving towards the lower boundary of the channel. The blue horizontal line is below the descending structure as a secondary support level. These two levels together constitute the key downward reference level shown in the chart.
If prices rebound at the bottom of the channel, the current consolidation pattern is maintained, and prices may then attempt to move towards the upper boundary of the channel again. However, the current chart does not confirm this rebound.
If prices decisively break channel support, the technical sequence will change. This weak performance will put the blue lines into the immediate focus. Therefore, if sellers continue to widen their decline, the correlation of this level will become higher.

Early charts also explain why consolidation is crucial to XRP. Prices underwent weeks of compression before previous breakthroughs gained momentum. The latest market structure repeats this pattern after another fierce directional movement.
Derivatives activity shows concentrated trading characteristics
Derivatives charts add another analytical dimension through open contracts and trading activity. According to the market data provided, the current price of XRP is US$1.34, and the 24-hour trading volume is approximately US$2.12 billion.
The positioning panel shows a sharp expansion between August 18 and 21. Along with the significant increase in long positions, a huge red histogram emerged. During this period, the largest green bar chart exceeded $80 million.
Binance leads with approximately US$493.17 million in terms of exchange open interest. Bybit followed closely with approximately $478.3 million, Gate held $285.31 million, and MEXC recorded approximately $272.13 million in the ranking displayed.
Trading volume showed stronger concentration, mainly in Binance's derivatives market. During the snapshot period, Binance recorded approximately US$1.07 billion in transaction volume. MEXC followed closely with $432.2 million, and Bitget reached $390.71 million.
The number of futures transactions further consolidated Binance's leading position in the data. During the period displayed, it recorded approximately 2.18 million transactions. Bybit followed closely with 625,050 transactions, and OKX recorded approximately 621,590 transactions.
Taken together, the chart shows the coexistence of consolidation and concentrated derivatives activity. The current key technical issue is still whether the channel support can be maintained. If this support level is decisively broken, the blue line will become increasingly important.