
 Exchange Ranking
 Top Exchanges
 24h Volume Ranking
 Popularity Ranking
 Exchange BTC Balance
 Proof of Reserves
 Decentralized Exchanges
 Funding Rate
 Funding Heatmap
 Liquidation Data
 Max Pain
 Long/Short Ratio
 Whale L/S Ratio
 Binance/Okex/Huobi L/S
 Bitfinex Margin L/S
 ETF Tracker
 Solana ETF
 XRP ETF
 Hong Kong ETF
 Bitcoin Treasuries
 Crypto Reversal
 Ethereum Reserves
 HyperLiquid Wallet Analysis
 Hyperliquid Whale Watch
 Large Transactions
 On-chain Movement
 Bitcoin ROI
 Stablecoin Market Cap
 Options Analysis
 News
News Articles
 Economic Calendar
 Features
 Wallet
 Contract Calculator


 Security
 Collections
 Watchlist
 Following
 NEAR
NEAR NEAR Protocol takes sharding infrastructure as its core selling point and aims to remain fast and low-cost as the scale of use expands, positioning itself for AI agents and daily applications, rather than relying purely on hype competition. This background provides useful information, but the August 2026 NEAR Protocol price forecast actually depends on what the current chart shows.
$NEAR is currently trading at US$1.62, up 2.0% during the day. The daily chart remains stable, while a bigger story is unfolding below the weekly chart.
NEAR Protocol Today's Price: Real-time Data and 24-hour Changes
$NEAR The current trading price is US$1.62, up 2.0% in the past 24 hours, with a range of US$1.57 to US$1.64. 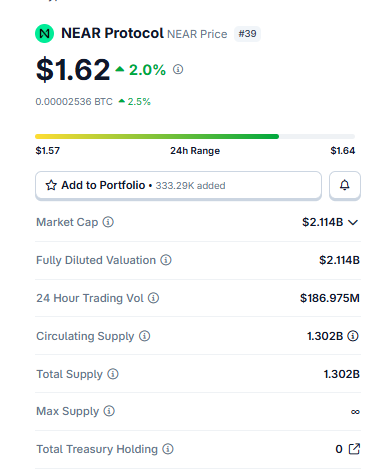 The market value is currently US$2.114 billion, and the fully diluted valuation is also US$2.114 billion, which is worth noting because this means there is no imminent unlocking selling pressure like many other altcoins. Trading volume in the past 24 hours was US$186.975 million. The circulation supply and total supply are both 1.302 billion NEAR, and there is no upper limit on the maximum supply because $NEAR adopts a moderate continuous issuance mechanism rather than a hard upper limit. The project treasury holdings are currently displayed as 0.
Technical Analysis: Key Support and Resistance Levels
NEAR Protocol Daily Chart Analysis
On the daily chart,$NEAR has been trading along a downtrend line for several weeks. The latest K-line opened at 1.622, hitting a high of 1.643, and falling to a low of 1.606, closing at 1.624, slightly up 0.12%.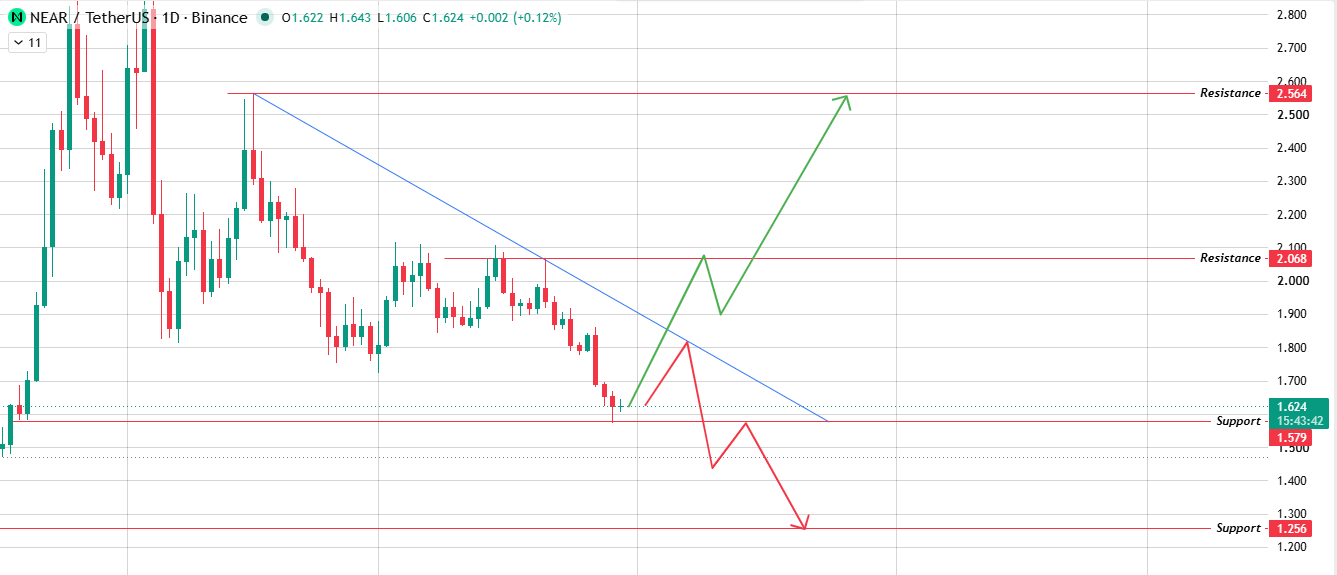 Prices are currently close to this trend line, which is usually the point where they break through or are blocked again. If it can break through with considerable volume, the upper resistance will be at $2.068, followed by $2.564. However, if the breakthrough fails or volume fails to keep up, the price is more likely to fall back to $1.579 first, and if this key support level cannot be held, it may fall further to $1.256.
NEAR Protocol Weekly Chart Trend Analysis
Zoom into the weekly chart, and the situation is different.$ NEAR has fallen sharply in recent weeks. The latest weekly K-line opened at 1.838, hitting a high of 1.860 and falling to a low of 1.571. It is currently running at 1.626, a weekly decline of 11.49%. 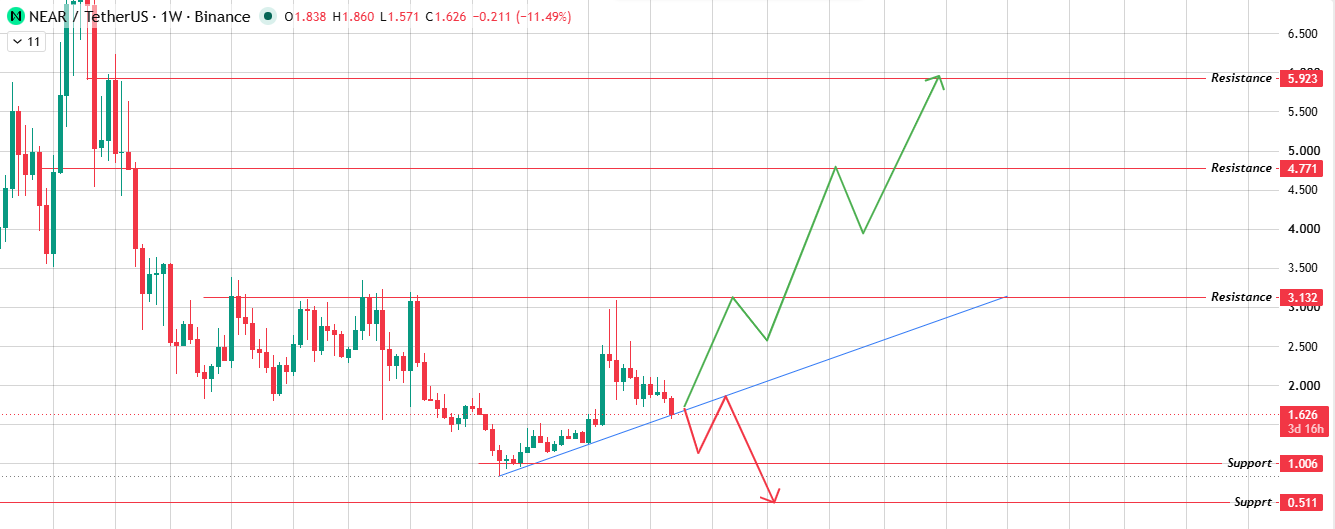 Since that low, prices have been hitting higher lows along an upward supporting trend line, an early pattern of reversal that is forming near current levels. Hold that trend line and break through the horizontal resistance above it, and the target will expand significantly: first at $3.132, then $4.771, and if the $NEAR bullish forecast is fully realized,$5.923 is the true long-term stretch target. Conversely, if the trend line is lost, the decline may extend to $1.006, with a deeper worse scenario on the chart at $0.511.
NEAR Protocol August 2026 Price Forecast: Bull, Baseline and Bear Scenarios
Bring the 2026 NEAR Protocol price target issue to the heart: Can $NEAR clear resistance above the daily chart while the early reversal structure of the weekly chart remains intact, or will the broader downtrend pull it back first?
Bull-market scenario: Target 2.068 - 2.564, expiration conditions if the daily trend line is blocked or the weekly close below $1.571.
Baseline scenario: Target of US$1.579 - 2.068 (range volatility), with an expiration condition that a confirmation close breaks through either boundary.
Bear market scenario: Target 1.579 - 1.256, expiration condition is to break below and stabilize at 1.571.
For bullish forecasts to come true,$NEAR requires actual volume to effectively break through the daily trend line, while the weekly uptrend structure remains below it. If it can be achieved, it will hit US$2.068 first and then US$2.564. If momentum continues to accumulate, a larger weekly target will open. The baseline situation is much more bland, with prices only fluctuating within the daily support and resistance range, and no direction is chosen. A bear market situation was triggered when $1.571 was broken below and settled because the level appeared on both daily and weekly charts, rather than just one.
On-chain and Fundamental Drivers (NEAR Protocol)
The market value of $NEAR is already at the same value as the fully diluted valuation, which is the most prominent detail in any current NEAR outlook. Unlike those tokens that still have a large number of locked supply to be unlocked, NEAR's entire supply of 1.302 billion tokens is already in circulation, which lacks a selling pressure factor to suppress gains compared to many other altcoins. Empty treasury holdings also mean that there are no obvious pools of tokens that will unexpectedly flood the exchanges, but NEAR's unlimited maximum supply does mean that gradual dilution is a permanent background factor that deserves long-term attention.
August 2026 may be a catalyst for the NEAR Protocol
NEAR's continued launch of artificial intelligence-centered infrastructure, new ecosystem partners, and stable developer activity are specific key NEAR factors worthy of attention this month. In addition, the broader altcoin liquidity situation and the market's overall risk appetite may be equally important, as NEAR's trend is influenced by both its own news and overall market sentiment.
Analyst Forecast (NEAR Protocol)
Anyone doing NEAR trend analysis is basically seeing two different stories right now, depending on the time frame chosen. The daily chart shows that the token is testing resistance after a difficult period and still needs to prove it can truly break through. Weekly charts show a steeper downtrend and may be building a bottom, with prices testing the uptrend line for the first time since the decline began. The sentiment in the NEAR Protocol price forecast chart remains cautiously optimistic as long as US$1.571 is held, and turns defensive once the rules are breached. These are not personalized financial advice, just chart-based analysis. Cryptocurrencies are volatile enough that no historical pattern can guarantee future results.
NEAR Protocol Long-term Outlook: 2027 - 2030
If $1.571 remains for the rest of 2026 and the weekly structure continues to be constructed as usual in early reversal models, a long-term rise to $3.132 or even $4.771 looks reasonable in 2027 and 2028. The actual price of NEAR Protocol through 2030 is likely to depend far less on any single chart level and more on the actual adoption of its infrastructure by developers and AI-related applications than just short-term price fluctuations.
Risk of possible invalidation of this prediction (NEAR Protocol)
The most obvious risk here is the weekly confirmed close below $1.571, which is the NEAR Protocol resistance-to-support level where two time frames meet. This would open a path to a short-term drop to $1.256, and a further drop to deeper weekly levels of $1.006 and $0.511 if the broader downtrend is re-established. On the other hand, if the daily trend line breaks through with real volume support, it may push $NEAR to break through resistance faster than the bull market scenario described above, especially when the weekly reversal structure is confirmed at the same time.
How to securely buy and store NEAR Protocol
$NEAR can be purchased on most major exchanges and is usually paired with USDT, USD or BTC. Since the entire supply of tokens is already in circulation, short-term price movements are driven more by demand and sentiment than by any upcoming unlocking plan. For larger-scale and long-term assets, hardware wallets are a safer option; for smaller amounts of assets that are more actively traded, software wallets or exchange wallets are also sufficient.
Disclaimer : This NEAR Protocol price forecast is for informational and educational purposes only and should not be regarded as financial or investment advice. The cryptocurrency market is extremely volatile and prices can change rapidly. Before making any investment decisions, be sure to research and consult a qualified financial adviser.






















