
 Exchange Ranking
 Top Exchanges
 24h Volume Ranking
 Popularity Ranking
 Exchange BTC Balance
 Proof of Reserves
 Decentralized Exchanges
 Funding Rate
 Funding Heatmap
 Liquidation Data
 Max Pain
 Long/Short Ratio
 Whale L/S Ratio
 Binance/Okex/Huobi L/S
 Bitfinex Margin L/S
 ETF Tracker
 Solana ETF
 XRP ETF
 Hong Kong ETF
 Bitcoin Treasuries
 Crypto Reversal
 Ethereum Reserves
 HyperLiquid Wallet Analysis
 Hyperliquid Whale Watch
 Large Transactions
 On-chain Movement
 Bitcoin ROI
 Stablecoin Market Cap
 Options Analysis
 News
News Articles
 Economic Calendar
 Features
 Wallet
 Contract Calculator


 Security
 Collections
 Watchlist
 Following
 XRP
XRP XRP, which signaled recovery in July, entered the new month with a big question mark in investors 'minds.
Although the star tokens of the Ripple ecosystem have performed strongly in July in recent years, they failed to continue the same success in August. Historical data shows that this period is usually difficult for XRP. So, will this situation change in 2026? Or is the cryptocurrency market preparing for a new round of correction?
Why did XRP perform strongly in July?
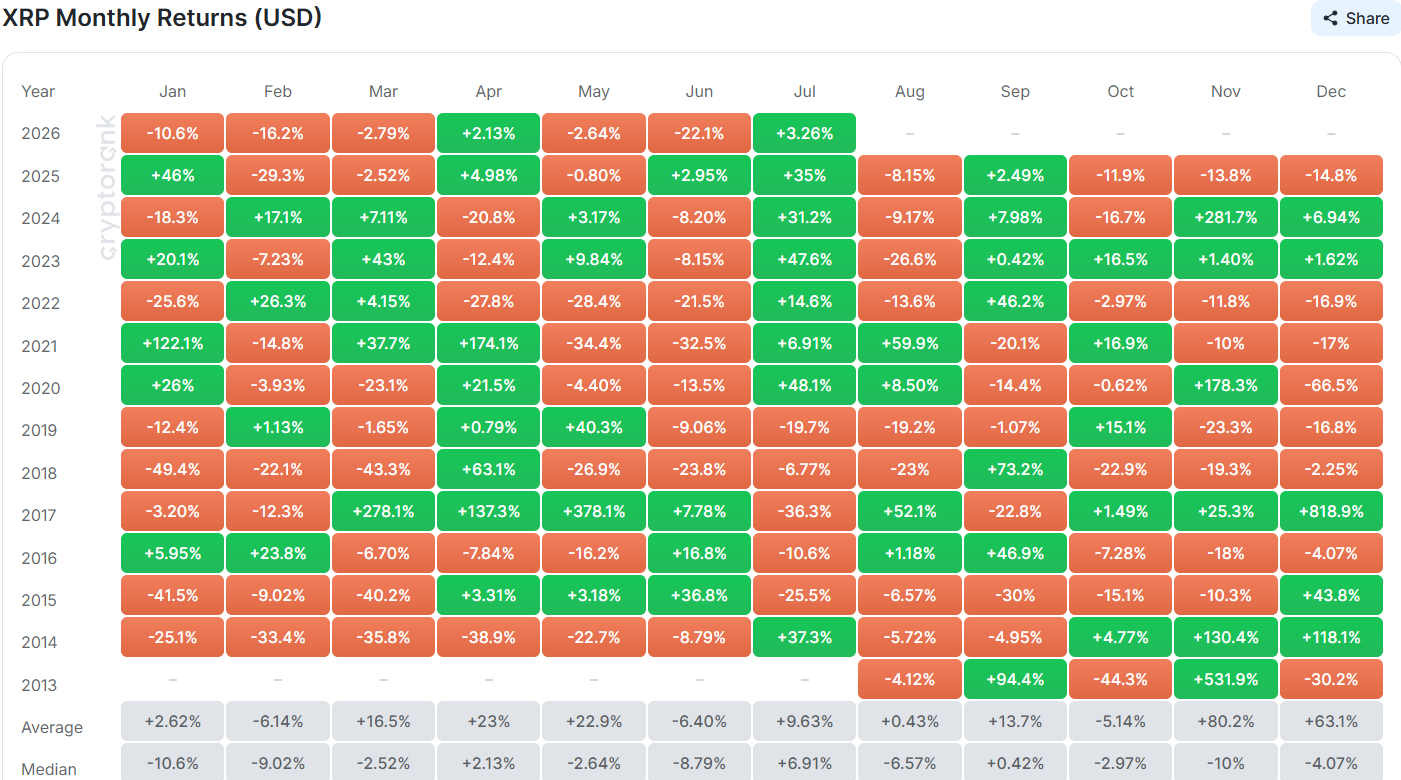
According to CryptoRank data, Ripple ended with a gain of about 3% in July 2026. Although this increase may not seem large, it brings an important statistic: XRP has risen for the seventh consecutive July since 2020, setting a record worthy of attention.
Since 2014, 8 of the 13 July months in statistics have closed positive. In terms of this performance, only April can match it. The strongest July increase occurred in 2020, when XRP's monthly increase exceeded 48%.
The upward trend continues in subsequent years: an increase of 47.6% in 2023, an increase of 31.2% in 2024, and an increase of 35% in 2025. The 3% increase in 2026 became the weakest performance in all positive July. Analysts believe this stems from continued bear markets, global uncertainty, inflation concerns and geopolitical risks.
Why is August considered a risk period for Ripple?
Although July showed positive trends, August data reminded investors to remain cautious. Ripple has ended in devaluation in the past four August months. It will fall by 13.6% in 2022 and 26.6% in 2023, making the decline even more severe.
This negative trend will continue in subsequent years: a decline of 9.17% in August 2024 and an 8.15% in August 2025. These data suggest that August has become one of the weakest periods for the asset in recent times.
What does historical data mean for XRP?
Looking back at historical statistics, XRP has risen in only 4 of the 13 August months it has experienced so far. This shows that the historical winning odds are quite limited.
However, considerable gains have been made in rising years. XRP rose by about 52% in August 2017 and reached a 60% increase in 2021. But both gains occurred in strong bull markets. Current market analysis shows that similar conditions have not yet been formed.
Can 2026 XRP break the curse of history?
Data shows a significant performance difference between July and August. On a historical average, XRP averaged a profit of approximately 6.91% in July, while during August, the median return fell 6.57%.
Despite this, XRP successfully rebounded in July after experiencing a sharp correction of more than 22% in June. The rebound in itself does not guarantee a new upward trend, but suggests that investors should pay close attention to price movements in the coming weeks.
This content in no way constitutes any investment advice. Markets have high risks, so please conduct independent research before making investment decisions.






















