
 Exchange Ranking
 Top Exchanges
 24h Volume Ranking
 Popularity Ranking
 Exchange BTC Balance
 Proof of Reserves
 Decentralized Exchanges
 Funding Rate
 Funding Heatmap
 Liquidation Data
 Max Pain
 Long/Short Ratio
 Whale L/S Ratio
 Binance/Okex/Huobi L/S
 Bitfinex Margin L/S
 ETF Tracker
 Solana ETF
 XRP ETF
 Hong Kong ETF
 Bitcoin Treasuries
 Crypto Reversal
 Ethereum Reserves
 HyperLiquid Wallet Analysis
 Hyperliquid Whale Watch
 Large Transactions
 On-chain Movement
 Bitcoin ROI
 Stablecoin Market Cap
 Options Analysis
 News
News Articles
 Economic Calendar
 Features
 Wallet
 Contract Calculator


 Security
 Collections
 Watchlist
 Following
 AKE
AKE AKEDO Price Forecast
AKEDO plunged more than 20% today, falling right on the uptrend line that has been supporting since mid-July, which became the real key turning point for the chart. The project is an AI-native content creation engine. Creators can generate games and digital assets through text instructions, and AKE tokens are used for fee payment, pledge and platform governance. This article will forecast the price trend of AKEDO: The following is a detailed analysis.
AKE Market Overview
Price: $0.00388392, 24-hour change: -20%, Market Value: $88.72M (-20%), 24-hour Trading Volume: $31M (-60.06%), Volume/Market to Market Ratio (24 hours): 35.58%, Fully Diluted Valuation: $389.08M, Liquidity/Market to Market Ratio: 1.50%, Total Supply: 100B AKE, Maximum Supply: 100B $AKE, Circulation Supply: 22.79B $AKE, Holders: 37.09K.
Clearing and Volume Data
Data shows that the total clearing amount within 24 hours was US$1.18 million, with long (US$577.01 million) and short (US$605.03 million) almost equally divided, indicating two-way fluctuations rather than unilateral squeeze. The pace of liquidation has accelerated significantly in the past 4 hours, reaching US$150,560 (of which bulls accounted for US$117,270), indicating that the recent sell-off has caught bulls who entered late by surprise. 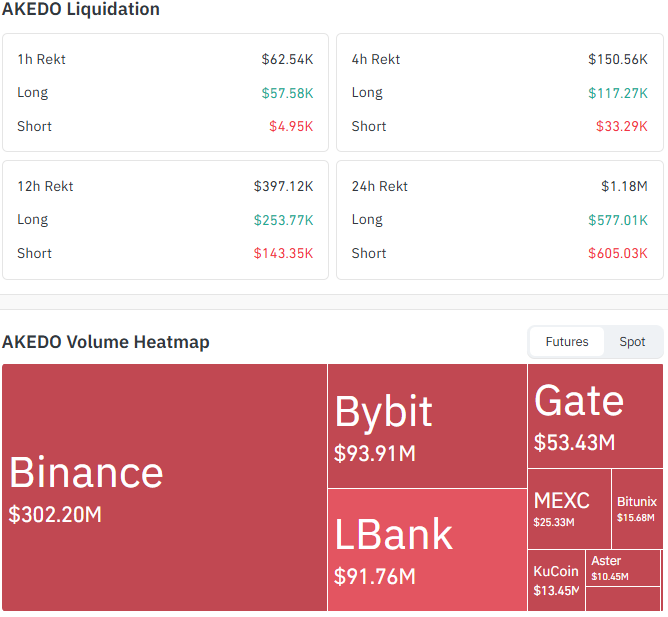 On the exchange side, futures trading volume was mainly concentrated in Binance (US$302.2 million), followed by Bybit (US$93.91 million) and LBank (US$91.76 million), and the remaining trading volume was distributed in Gate, MEXC, Bitunix, KuCoin and Aster. This futures trading activity is separate from the above-mentioned spot trading volume of US$31 million.
AKEDO 2026 Price Forecast: Chart Analysis
Trading Pair: AKEDO/USD ·Market: Spot·Timeframe: 4-hour K-Line·Timestamp: July 29, 2026 10:28 UTC+5:30
AKE's current trading price is US$0.0038839, down 20% in 24 hours. The price is directly at a critical position, which is the uptrend line that has been supported for every correction since the breakout rebound. The short-term EMA almost coincides with the current price (US$0.0038414), strengthening the region's status as a true decision-making point. The RSI (14) is at a neutral level at 53.84, indicating that there is neither strong bullish nor bearish momentum at the moment. Here, the trend line test is more critical than the indicator.
If the trend line is broken, the lower levels will become the focus in turn: first US$0.0037245, then the longer cycle EMA and support near US$0.0030981, then US$0.0028843, and a deeper bottom of US$0.0020441. If AKE remains above uptrend line support, it may rebound to the first resistance level of $0.0042218. Breaking through this level could open the door to $0.0048731, with the next major upside target being $0.0063408. 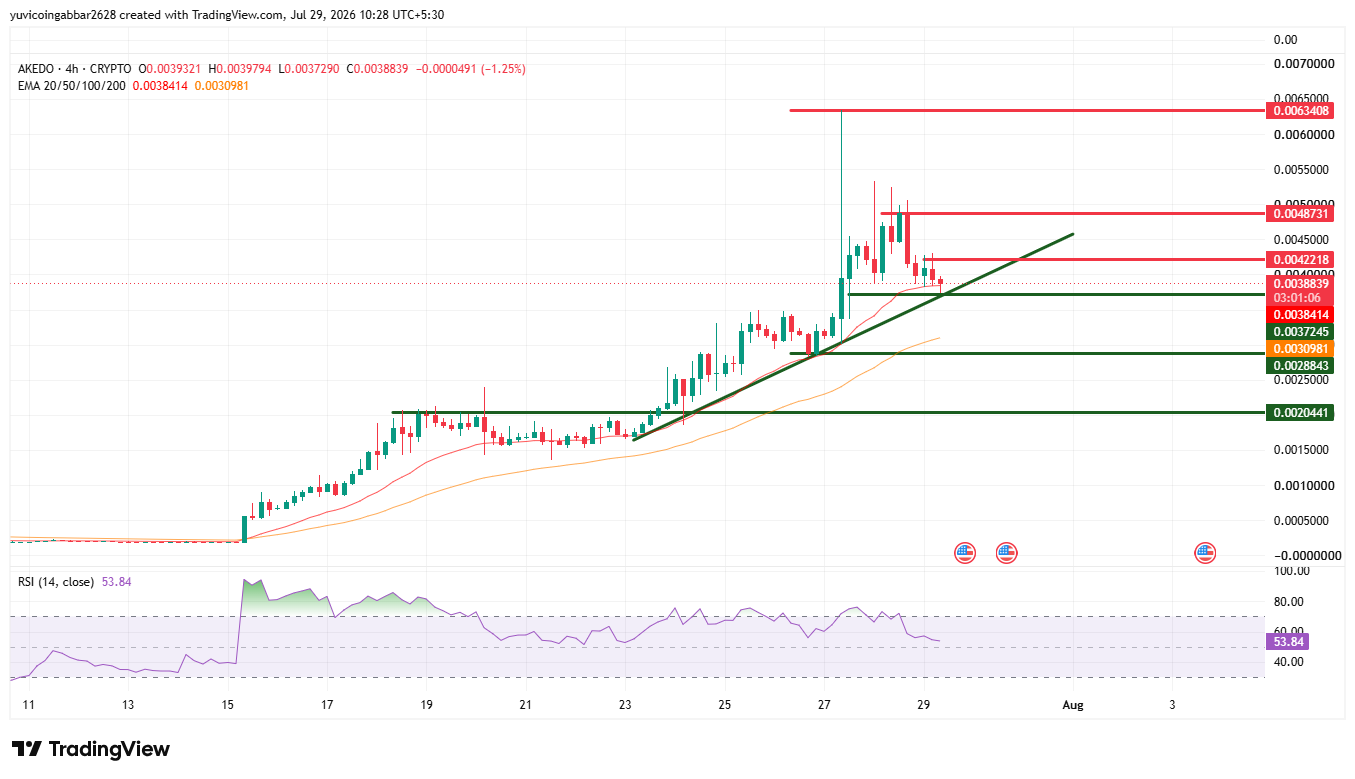
AKE technical analysis: Technical level
Resistance level 3:$0.0063408, previous high, bullish target; Resistance level 2:$0.0048731, near-term supply area; Initial recovery level: $0.0042218, EMA/Resistance level recovered; Current price reference: $0.0038839; First support level: $0.0037245, uptrend line; Deeper support level: $0.0028843, EMA 50/support cluster; bottom support: $0.0020441, fell below the risk bottom.
Bullish scenario versus bearish scenario
Bullish scenario: If AKE holds the trend line and US$0.0037245 support, the path of minimum resistance is back to US$0.0042218, then US$0.0048731. A strong recovery of US$0.0048731 with volume will make the July high of US$0.0063408 a touchable extension target.
Bear scenario: Confirm that the closing price is below the trend line and US$0.0037245 will turn into a bearish pattern. This would open up room for a slide towards $0.0030981, and if this level fell, it would expose $0.0028843 and a deeper bottom of $0.0020441.
Can AKE touch US$0.0063408?
Yes, but only if the trend line is held first. AKE needs to recover US$0.0042218 and then break through US$0.0048731 as the volume amplifies, before the July high of US$0.0063408 can be achieved. Considering that the 24-hour volume/market cap ratio reaches 35.58%, if buyers hold on to the current zone, the market has enough active trading to support rapid gains, but this depends on the trend line not breaking below in the next few trading sessions.
What happens if the trend line breaks below?
A confirmation below US$0.0037245 would be the clearest bearish signal on the chart. This could trigger a decline towards the US$0.0030981 support level, and if it falls, US$0.0028843 and US$0.0020441 will become the next reference points. Given that bulls have accounted for the majority of recent liquidations, a break in the trend line could accelerate the capitulation of bulls.
Expert opinion
According to analysts, the current market pattern is indeed balanced: RSI is neutral, prices are just right at the trend line support, and long and short liquidations are almost equally divided. This is a market waiting for a catalyst, not a market with clear directional preferences. The K-line closing above or below $0.0037245 in the next few 4 hours may be more telling than any single indicator on the chart.
Disclaimer : This article is for reference only and should not be regarded as investment advice. The cryptocurrency market is highly volatile and readers should study for themselves before making any financial decisions.






















