
 Exchange Ranking
 Top Exchanges
 24h Volume Ranking
 Popularity Ranking
 Exchange BTC Balance
 Proof of Reserves
 Decentralized Exchanges
 Funding Rate
 Funding Heatmap
 Liquidation Data
 Max Pain
 Long/Short Ratio
 Whale L/S Ratio
 Binance/Okex/Huobi L/S
 Bitfinex Margin L/S
 ETF Tracker
 Solana ETF
 XRP ETF
 Hong Kong ETF
 Bitcoin Treasuries
 Crypto Reversal
 Ethereum Reserves
 HyperLiquid Wallet Analysis
 Hyperliquid Whale Watch
 Large Transactions
 On-chain Movement
 Bitcoin ROI
 Stablecoin Market Cap
 Options Analysis
 News
News Articles
 Economic Calendar
 Features
 Wallet
 Contract Calculator


 Security
 Collections
 Watchlist
 Following
 ADA
ADA Cardano traded at $0.1638 after three days of strong rally from $0.1535, and market momentum has quietly shifted in favor of buyers.$ 0.18 Zone is where $ADA encountered resistance a week ago and a key level to confirm the end of the July downward trend. To reach this position, you need to first break through $0.1751. Here is the interpretation of the probability on the 3-hour chart.
What does the Cardano 3-hour chart currently show?
The 3-hour chart shows that ADA is within a wide range and shows a clear pattern of falling highs. The month opened with a strong surge, soaring to $0.200 on July 5, but the trend encountered resistance almost immediately and gave up all gains within 48 hours.
The second attempt occurred on July 23, and Cardano pushed it to about $0.1805 before falling back again. This lower high is important because it confirms that sellers step in earlier in each rally. The price then slipped to $0.1535 on July 27, and the buyer finally defended here.
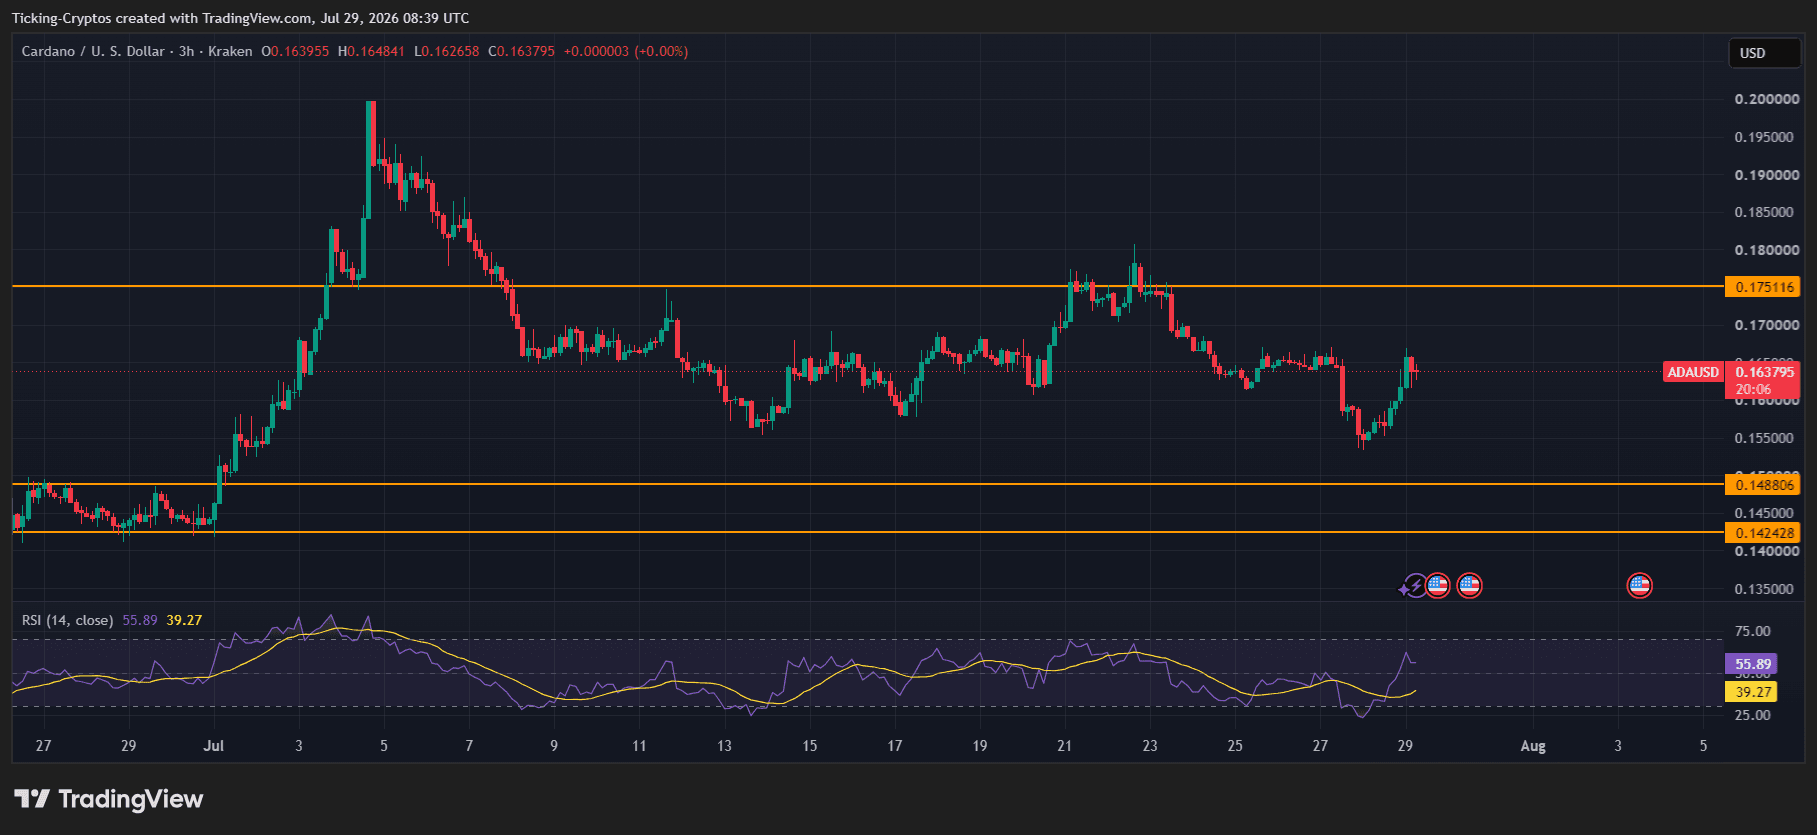 The current K-line is at $0.1638, with an intraday high of $0.1648 and a low of $0.1626. In other words, the ADA has rebounded about 6.7% from its swing lows, but is still nearly 18% below its July peak.
The structure to keep in mind is simple: three levels define all trends. Resistance is at $0.1751, support is at $0.1488, and a deeper support platform of $0.1424, which dates back to the suction area at the end of June.
Why is $0.1751 the key level that determines the next trend of ADA?
$0.1751 is not an arbitrary line. It is the suppression level that rebounded after the entire rally in early July, and is located just above the upper shadow line where it was blocked on July 23. All ADA movements over the past four weeks have occurred below it.
Starting from $0.1638, this resistance level is about 6.9%. If the 3-hour chart closes cleanly above $0.1751, preferably accompanied by increased volume rather than a single upper shadow, it will break the sequence of falling highs and make the $0.180 area a priority target again. Further up, the July high of $0.200 will become a clear attraction, and regaining that position will be the ADA's first truly bullish monthly signal since spring.
Until then, every increase towards $0.175 should be regarded as a supply area rather than a breakthrough.
What happens if Cardano loses $0.1488?
The bearish scenario is equally clear.$ 0.1488 It is the first real support below the current price, about 9.2% lower, and coincides with the top of the fundraising zone established by ADA at the end of June.
If the closing price falls below this level,$0.1424 will become the next stop, which is about 13% lower than the current price. This level is the bottom of the June fundraising range and the last structural support before Cardano falls back to the multi-year low set at the end of June. At the time, the ADA closed at close to $0.1453 after falling nearly 40% during the month.
Notable nuances: The July 27 low of $0.1535 is firmly above $0.1488. This is a higher low than the bottom of June and the single most constructive signal on this chart.
Is the RSI signal reliable enough?
The 14-cycle RSI reading was 55.89, with its moving average at 39.27. This gap illustrates two issues.
First of all, the RSI dropped to nearly 20s during the sharp decline on July 27, which is a truly oversold reading on the 3-hour time frame, and the rebound started directly from here. Secondly, the RSI has now decisively re-crossed its signal line, a shift in momentum that usually signals at least a test of resistance above.
What needs to be noted is the speed of this change. The rise from oversold territory to 56 in three trading sessions was a quick re-pricing, and the RSI is now entering the territory where the previous July rally was blocked. Kinetic energy is improving, but a trend shift has not yet been confirmed. This confirmation only comes from the price closing above $0.1751.
What fundamentals may support Cardano prices?
Technical aspects do not operate in vacuum. Cardano has just gone through one of its busiest development phases: the Van Rossem hard fork upgrades the network to protocol version 11, adds Plutus built-in functions and updates the cost model, reducing the resources needed to run complex smart contracts. This is also the first Cardano upgrade to be fully approved through the on-chain Voltaire governance system.
This is followed by Ouroboros Leios, a scalable upgrade that entered the public test network in June, with the goal of launching the main network by the end of 2026. Charles Hoskinson described this as a step change in throughput, with values circulating in the community ranging from 10 to 65 times, but these numbers still have to withstand the test of actual loads.
In terms of on-chain data, Sanitation data shows that addresses holding 10 million to 100 million ADAs increased their supply share from 37.66% to 38.13% during the June decline. The whale's ability to attract funds in a weak position does not accurately determine the bottom, but it does explain why $0.1424 has been held so far. On the downside, average daily trading volume fell to about 17,400 transactions at the end of June, near a 45-day low, so usage has not kept pace with development activity.
What are the key levels for ADA to focus on?
Resistance 1:$0.1751, suppressing all levels of rebound this month
Resistance 2:$0.180, July 23 blocked high
Resistance 3:$0.200, July peak
Support 1:$0.1535, July 27 swing low
Support 2:$0.1488, the first structural support
Support 3:$0.1424, the bottom of the funding zone in June
The basic scenario is that the range continues: ADA fluctuates between $0.1488 and $0.1751, and the market waits for a catalyst. The bullish trigger is a 3-hour close above $0.1751. The bearish trigger is a closing price below $0.1488. Everything in between is noise.






















