
 Exchange Ranking
 Top Exchanges
 24h Volume Ranking
 Popularity Ranking
 Exchange BTC Balance
 Proof of Reserves
 Decentralized Exchanges
 Funding Rate
 Funding Heatmap
 Liquidation Data
 Max Pain
 Long/Short Ratio
 Whale L/S Ratio
 Binance/Okex/Huobi L/S
 Bitfinex Margin L/S
 ETF Tracker
 Solana ETF
 XRP ETF
 Hong Kong ETF
 Bitcoin Treasuries
 Crypto Reversal
 Ethereum Reserves
 HyperLiquid Wallet Analysis
 Hyperliquid Whale Watch
 Large Transactions
 On-chain Movement
 Bitcoin ROI
 Stablecoin Market Cap
 Options Analysis
 News
News Articles
 Economic Calendar
 Features
 Wallet
 Contract Calculator


 Security
 Collections
 Watchlist
 Following
 BNB
BNB The BNB price outlook remains positive, with prices approaching the peak of a multi-week consolidation pattern and approaching resistance. The previous increase was accompanied by an increase in trading volume, while recent activities indicate that market participation has rebounded and there are obvious signs of attracting funds. After June fluctuations, futures bursts tended to ease, indicating that leverage has returned to normal as BNB stabilizes above key support levels. The BNB price outlook has attracted much attention, and the token is approaching a technical breakthrough point after several weeks of consolidation. Market participants continue to track price structure, volume and futures positions for directional confirmation.
The consolidation pattern is coming to an end
BNB experienced a long-term correction after hitting a record high in October 2025, with a decline of about 58% of the cycle high. Selling pressure dominated the early pullbacks. Prices then entered a narrower range of shocks in July, and a symmetrical triangle gradually formed on the chart. The downward resistance line continues to meet stable horizontal support. 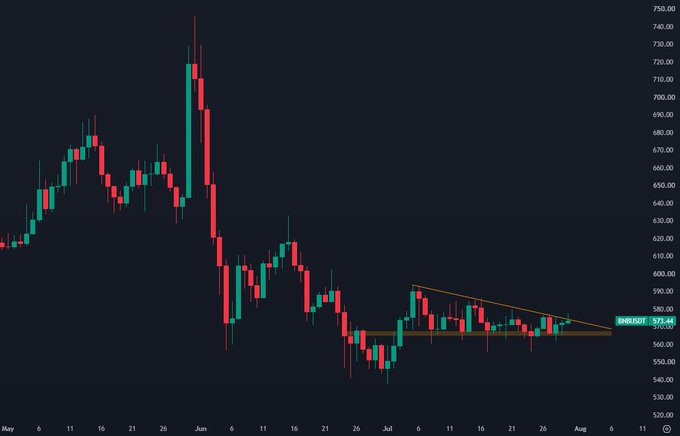
The latest charts shared via social media focus on this pattern. The post pointed out that BNB is trying to break through upward, but this action has not yet been confirmed. As of the publication, the technical structure has changed from the previous sharp decline. The price compression reflects reduced volatility in recent trading days. Such patterns often indicate stronger directional movement.
Volume supports rebound attempts
Historical volume data provides additional market context. BNB had previously risen from nearly $250 to about $700, a rise that was accompanied by strong participation.
Higher volume supported the strongest gains. Multiple rallies have attracted continued buying activity. Increased participation usually strengthens bullish momentum. Consolidation followed, despite repeated surges in trading volume. Buyers and sellers frequently change hands, but no clear direction has been formed. This balance limits large price fluctuations. Recent trading days once again showed stronger trading participation. BNB is currently trading at approximately US$586.75, a daily gain of 3.19%, and a gain of 3.36% in the past week.
Futures markets appear more balanced
Perpetual contract burst data reveals changes in market conditions. A large number of clusters of short positions occurred from the end of May to the beginning of June. Volatility forces both long and short positions to be closed. Short positions expanded in the early stages of the rapid rise, and then sharply reversed prices led to long positions. This sequence reflects the instability of leveraged positions. During the July consolidation period, explosive activity gradually decreased, and extreme peaks were replaced by smaller explosive events. Futures positions are therefore becoming increasingly balanced. Price stability and leverage easing together support the current technical structure. Once a breakthrough is confirmed, higher resistance levels between $590 and $620 may be tested. If the breakthrough triangle fails, BNB may fall back to the established support level and then try to break through again.






















