Exchange Ranking
 Top Exchanges
 24h Volume Ranking
 Popularity Ranking
 Exchange BTC Balance
 Proof of Reserves
 Decentralized Exchanges
 Funding Rate
 Funding Heatmap
 Liquidation Data
 Max Pain
 Long/Short Ratio
 Whale L/S Ratio
 Binance/Okex/Huobi L/S
 Bitfinex Margin L/S
 ETF Tracker
 Solana ETF
 XRP ETF
 Hong Kong ETF
 Bitcoin Treasuries
 Crypto Reversal
 Ethereum Reserves
 HyperLiquid Wallet Analysis
 Hyperliquid Whale Watch
 Large Transactions
 On-chain Movement
 Bitcoin ROI
 Stablecoin Market Cap
 Options Analysis
 News
News Articles
 Economic Calendar
 Features
 Wallet
 Contract Calculator


 Security
 Collections
 Watchlist
 Following
 XRP
XRP XRP network activity recorded 49,929 active addresses in 24 hours, setting a new high in more than two months. The three-month average of inflows from major Binanhang XRP companies fell to the lowest level since 2021, indicating that selling pressure has weakened. XRP remains below the 50-day and 200-day moving averages, with US$1 as support and US$1.07 to US$1.10 as the key recovery range.
As market negative sentiment reaches its three-month extreme, XRP is testing the $1 barrier while online activity is rising. Sanitation Intelligence reported 49,929 active addresses in 24 hours, the highest level in more than two months. At the same time, Darkforst said that the three-month average of inflows from large Binanhang XRP companies has dropped to its lowest level since 2021.
Internet activity rises
Sanitation said XRP discussions on X, Reddit, Telegram and other cryptocurrency channels have become increasingly bearish this week. The shift came after XRP failed to rebound and its market value fell below $1. However, XRP Ledger activity increased significantly after approaching a 2026 low in early July. Sanitation recorded 49,929 active addresses in 24 hours. The chart provided also shows that the number of daily active addresses is close to 20,400, while the number of holders has steadily increased to approximately 8.05 million.
Inflows from large Binance households decline
Darkforst reported that the latest data showed that inflows from major XRP companies to Binance dropped to US$61 million. The indicator uses a three-month average to track trends. For comparison, inflows from large households reached US$456 million in January 2025 and US$355 million in October. Current inflows are six to eight times lower than previous levels. Despite low inflows, net flows remained positive at approximately $18.8 million. Darkforst said that inflows from the currency still exceed outflows.
The analyst also pointed out that inflows and trading volumes across the market are declining. Darkforst described this as selling dried up and demand had not yet increased.
XRP is still below the key moving average
The chart shows that XRP was around US$1.001 on August 15, after experiencing a mid-term decline that began in February. XRP was mainly trading between $1.35 and $1.55 before the decline accelerated in late May and June. 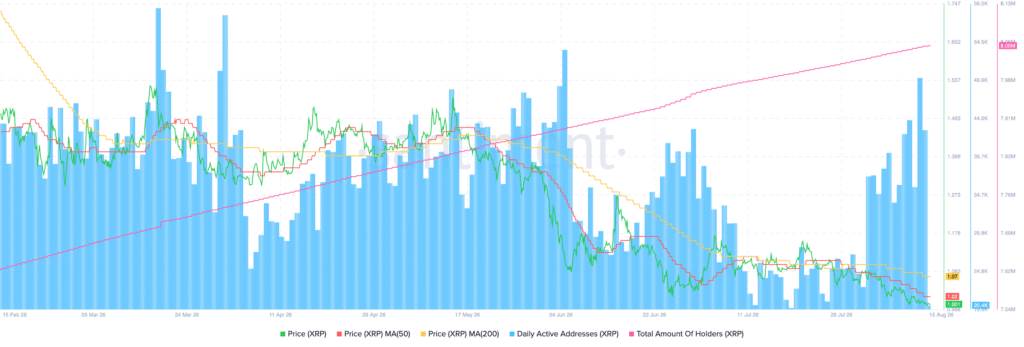
Prices then fell towards the US$1.05 to US$1.10 range, forming lower highs and lower lows. The 50-day moving average is close to $1.02, while the 200-day moving average is around $1.07. XRP is still below both moving averages, and the 50-day moving average is also below the 200-day moving average. The US$1 mark is a direct psychological support level. The chart shows resistance in the $1.02,$1.07 and $1.10 to $1.18 range, and identifies $1.07 to $1.10 as a key recovery area.