
 Exchange Ranking
 Top Exchanges
 24h Volume Ranking
 Popularity Ranking
 Exchange BTC Balance
 Proof of Reserves
 Decentralized Exchanges
 Funding Rate
 Funding Heatmap
 Liquidation Data
 Max Pain
 Long/Short Ratio
 Whale L/S Ratio
 Binance/Okex/Huobi L/S
 Bitfinex Margin L/S
 ETF Tracker
 Solana ETF
 XRP ETF
 Hong Kong ETF
 Bitcoin Treasuries
 Crypto Reversal
 Ethereum Reserves
 HyperLiquid Wallet Analysis
 Hyperliquid Whale Watch
 Large Transactions
 On-chain Movement
 Bitcoin ROI
 Stablecoin Market Cap
 Options Analysis
 News
News Articles
 Economic Calendar
 Features
 Wallet
 Contract Calculator


 Security
 Collections
 Watchlist
 Following
 ADA
ADA  SOL
SOL  XRP
XRP Cryptocurrency prices have fluctuated within a narrow range in the past few days and have not shown a decisive trend. At first glance, this price trend may seem unremarkable, but it usually signals that the market is building up momentum for the next round. Solana, XRP and Cardano are currently trading near key technology levels. These levels will determine whether buyers can regain control of the situation or sellers will lower prices further in the following trading session.
A closer look at the chart shows that each token has its own story.
Solana continued to hold support with limited kinetic energy.
XRP is still trapped in a narrow range after several quiet trading sessions.
Cardano held on to recent gains, but new buying pressure is facing an important test.
The following is what the latest charts and technical indicators reveal on today's prices for Solana, XRP and Cardano.
Solana prices continue to fluctuate within narrow ranges
Solana prices have been sideways in the past few days. SOL prices have remained between $0.359 and $0.37, indicating that neither buyers nor sellers are fully in control of the situation.
If market momentum remains unchanged, this consolidation trend may continue. Prices usually stay in these ranges until a major catalyst appears to bring enough buying or selling pressure to drive a breakthrough.
A break below US$0.359 would weaken the current structure. If selling pressure increases, this could open the door for prices to fall towards $0.339.
A breakthrough of US$0.388 will form a more positive situation. If buyers maintain control, the breakthrough could push SOL prices to the $0.41 region.
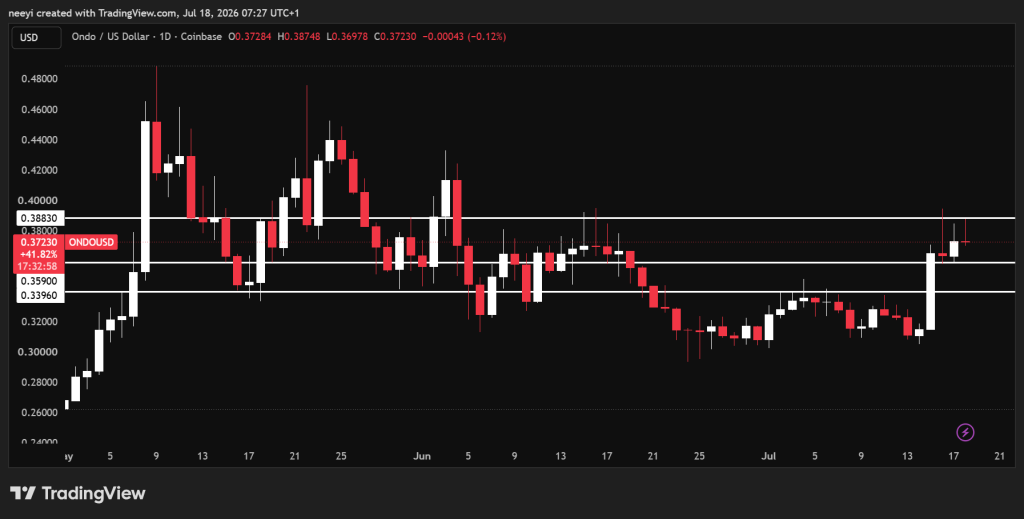 ONDOUSD Price Chart / TradingView.com
Current technical indicators show signs of moderate excess.
The Relative Strength Index (RSI) is 59.827, sending a buy signal. The reading shows that the current buying force is stronger than selling pressure, but it has not entered overbought territory.
The Stochastic Oscillator reads 57.063, which also sends a buy signal. This suggests that short-term momentum is improving after several days of sideways trading.
MACD currently reads 0.013, sending another buy signal. A positive MACD usually indicates that bullish momentum is still there, but a stronger price movement is needed to provide additional confirmation.
The Ultimate Oscillator is 52.726, which also sends a buy signal. The indicator combines multiple time frames to show stable buying activity in the market.
Solana (SOL) price forecast today
Bullish scenario: If buying pressure increases, a breakthrough of US$0.388 could push SOL prices to US$0.41.
Neutral scenario: Solana continues to move sideways between US$0.359 and US$0.37, with buyers and sellers remaining balanced.
Bear scenario: A break below US$0.359 may push SOL prices to the next support level near US$0.339.
XRP prices are still trapped in narrow ranges
XRP prices have also fluctuated within a very narrow range over the past two days. Prices are trading between $1.08 and $1.09, with no clear direction established.
This narrow price volatility often suggests that the market is waiting for new momentum before making the next move.
Support levels near US$1.08 remain important. A break below that level could weaken the XRP price and push it down towards $1.071.
Resistance near $1.09 continues to limit upside. A successful breakthrough in this level could lift XRP prices above $1.10.
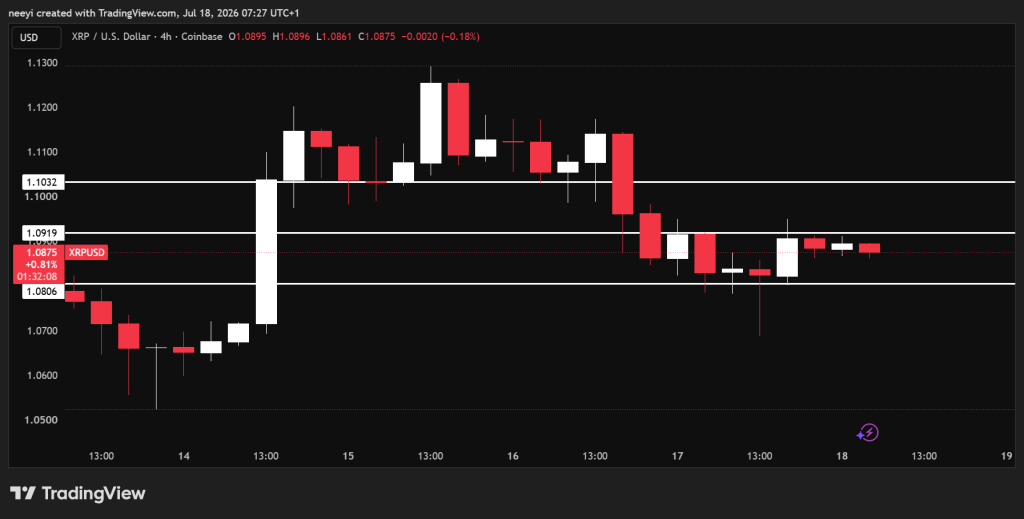 XRPUSD Price Chart / TradingView.com
Current technical indicators are slightly cautious.
The Relative Strength Index (RSI) is 45.371, sending a neutral signal. This shows that neither the buyer nor the seller currently has a clear advantage.
The Stochastic Oscillator reads 31.094, giving a sell signal. The momentum has weakened during the recent consolidation period.
MACD is currently at-0.004, giving a sell signal. A negative MACD usually indicates that bearish momentum is slightly stronger than bullish momentum.
The Ultimate Oscillator read 48.023, sending another sell signal. The reading suggests that buying pressure remains limited over multiple time frames.
XRP Today's Price Forecast
Bullish Scenario: If buyers return, a breakthrough of $1.09 could push XRP prices above $1.10.
Neutral scenario: XRP continues to trade between US$1.08 and US$1.09 until stronger momentum appears.
Bear scenario: A break below $1.08 could push the XRP price towards $1.071.
Although Cardano prices have corrected slightly, they have remained strong in the near term.
Cardano prices have outperformed several major cryptocurrencies in recent trading hours. ADA prices have closed in positive territory for all of the past five 4-hour candle lines, and then the current 4-hour candle line has fallen.
This small correction will not automatically change the overall pattern. Buyers are still defending most of the recent gains.
ADA prices are currently trading slightly below the US$0.168 level. Breaking through this resistance could push Cardano prices to $0.171.
Support levels near US$0.166 are equally important. A break below this level could push the ADA price towards $0.163.
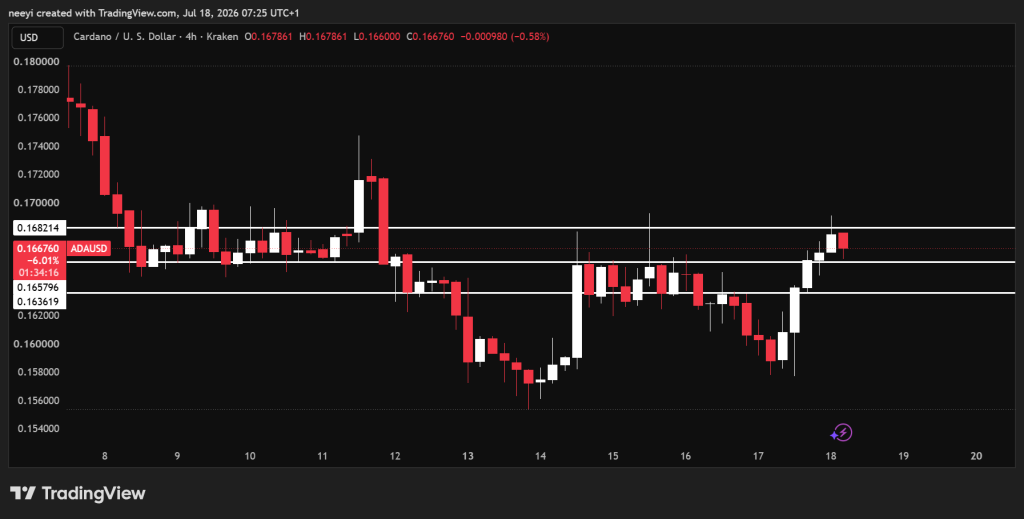 ADAUSD Price Chart / TradingView.com
Technical indicators continue to show mixed signals, but are generally positive.
The Relative Strength Index (RSI) is 56.094, sending a buy signal. This reading indicates healthy buying pressure and has not put the ADA into overbought status.
The random oscillator reads 52.523 and emits a neutral signal. After recent gains, short-term momentum is currently balanced.
A MACD of 0 sends a neutral signal. This suggests that bullish and bearish momentum are almost completely balanced.
The Ultimate Oscillator reads 53.28, giving a buy signal. Buying pressure in multiple time frames is still slightly stronger than selling pressure.
Cardano (ADA) Today's Price Forecast
Bullish scenario: A breakthrough of $0.168 could push the ADA price to $0.171.
Neutral scenario: Cardano continues to trade between $0.166 and $0.168, with buyers defending recent gains.
Bear scenario: A break below $0.166 may push the ADA price towards $0.163.
Frequently Asked Questions
Does Cardano (ADA) have a future?
Cardano (ADA) has a future as a secure and methodically developed blockchain. However, due to the slow adoption of ecosystems and lack of external liquidity, their long-term growth remains highly controversial. Although it has top-notch technology and an active developer community, it faces fierce competition from the faster-growing network.
Will Cardano rise in 2026?
Cardano (ADA) is currently trading in the range of US$0.16 to US$0.20, and whether it will rise in 2026 remains controversial. Market analysts 'price forecasts usually set the year-end average price at $0.23 to $0.50.
Is Ripple (XRP) worth investing in?
Ripple is a company that provides users with a blockchain-based digital payment network. XRP is a cryptographic asset that facilitates payments on the network.






















