
 Exchange Ranking
 Top Exchanges
 24h Volume Ranking
 Popularity Ranking
 Exchange BTC Balance
 Proof of Reserves
 Decentralized Exchanges
 Funding Rate
 Funding Heatmap
 Liquidation Data
 Max Pain
 Long/Short Ratio
 Whale L/S Ratio
 Binance/Okex/Huobi L/S
 Bitfinex Margin L/S
 ETF Tracker
 Solana ETF
 XRP ETF
 Hong Kong ETF
 Bitcoin Treasuries
 Crypto Reversal
 Ethereum Reserves
 HyperLiquid Wallet Analysis
 Hyperliquid Whale Watch
 Large Transactions
 On-chain Movement
 Bitcoin ROI
 Stablecoin Market Cap
 Options Analysis
 News
News Articles
 Economic Calendar
 Features
 Wallet
 Contract Calculator


 Security
 Collections
 Watchlist
 Following
 BTC
BTC  XRP
XRP XRP prices have hardly surprised traders this week. The token fluctuated within a narrow range and eventually returned to a position close to the opening price. However, this calm weekly performance may not last long.
Bitcoin is still near an important resistance zone, Ripple faces another week of regulatory uncertainty, and XRP has begun to form an uptrend line. These factors may determine whether XRP prices exceed $1.20 in the coming week or fall back to near $1.00.
XRP started the week at close to $1.09, then fell to a weekly low of around $1.08. The price then rebounded with several mainstream cryptocurrencies, reaching about $1.16 at one point. But this rebound is difficult to maintain. XRP fell again, back to about $1.09, almost unchanged from its opening price at the beginning of the week.
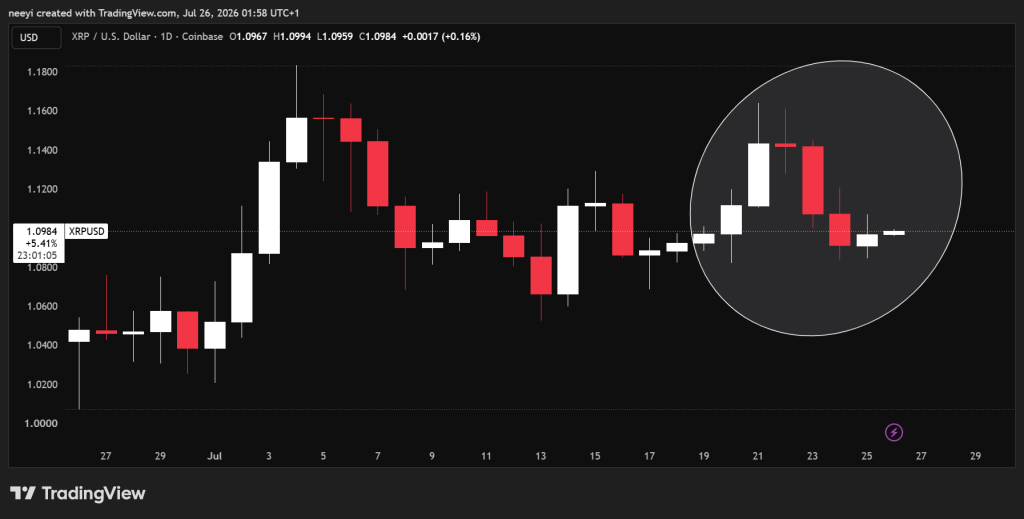 The XRP chart shows the trend of the past few days
This trend reveals two important price levels. Buyers continue to defend ground near $1.08, although XRP struggles to maintain above $1.15 resistance. If the price can break through this range more strongly, it will determine the next direction of XRP.
Bitcoin, Clear Act and ETF fund flows may affect XRP prices
In the coming week, a number of market and regulatory factors may affect XRP prices. The direction of Bitcoin remains one of the most important factors, as BTC generally controls the liquidity of the entire cryptocurrency market.
Bitcoin has recently failed to break through the $66,000 resistance level and has fallen back to around $64,000. If it weakens further below $60,000, it may put pressure on XRP and bring the $1.00 support level back into view.
Bitcoin sideways consolidation may produce different results. When BTC is traded within a narrow range, funds sometimes flow to mainstream altcoins. In this case, XRP can gain more room to rebound without having to rise significantly in Bitcoin.
Regulatory developments may have a greater impact because XRP is highly sensitive to U.S. policy news. The Clarity Act would classify XRP as a digital good and provide clearer legal protection. Treasury Secretary Scott Bessant has previously said the bill is already at the "one-yard line" before the Senate recess in August. Majority Leader John Thun later said the proposal was likely to miss the window.
The bill does not need to be passed this week to affect XRP prices. Updates on possible delays, renegotiations or renewed divisions in the Senate could trigger significant price swings. Polymarket said the probability of the bill passing this year has dropped to about 42%. This decline in probability coincides with the consolidation of XRP around $1.10.
The partisan controversy over the ethics clause related to President Donald Trump remains another obstacle. The latest comments from lawmakers such as Chuck Schumer or Cynthia Loomis could change market expectations this week.
Institutional needs are also worthy of attention. The spot XRP ETF connects the token closer to Wall Street capital, so daily capital flows become an important market signal. Whale accumulation remained strong in early summer. The recent outflow of funds from spot ETFs has put more pressure on XRP prices. Upcoming institutional buying data will show whether demand is picking up or whether weakness is still lingering.
XRP prices are testing uptrend line support
Looking at the XRP chart, you can see that there is an uptrend line below the latest price trend. XRP has begun to use the upper region of the pattern as support, creating a potential basis for another rebound.
If trend line support continues to be effective, XRP prices may rebound to around US$1.20. Stronger buying pressure could then push prices to short-term highs between $1.20 and $1.30.
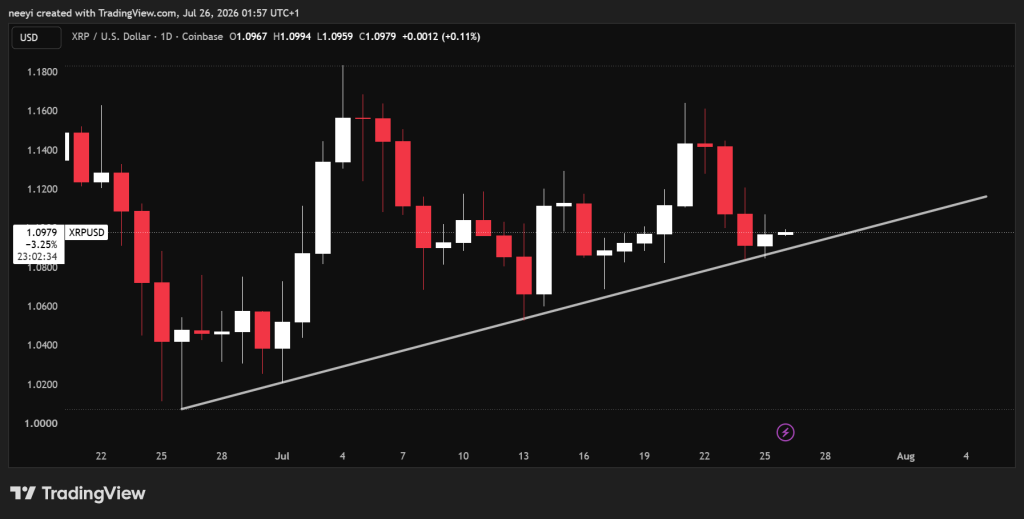 The XRP chart shows that the uptrend line
The trend line remains the key to this pattern. A clear break below this trend line will weaken the bullish structure and could push XRP to $1.008. If it falls further below US$1.008, it will expose the next major support level of approximately US$0.90. If Bitcoin falls below $60,000 or regulatory concerns intensify, the likelihood of this lower target will increase.
The current chart level thus forms a clear dividing line. Getting support above the uptrend line will help rebound again, while a break below will open up room for deeper support.
XRP has been trading sideways between US$1.08 and US$1.15 for 6 weeks
The XRP weekly chart provides another perspective on the current structure. Over the past six weeks, XRP prices have traded mainly in a sideways pattern, with most of the major fluctuations occurring between $1.08 and $1.15.
XRP tried to break through the US$1.15 resistance this week, but the momentum for the breakthrough weakened and the token fell back to about US$1.09. A successful breakthrough of $1.15 next week will strengthen the bullish reasons. XRP may then target $1.20 and then test the upper price area around $1.30.
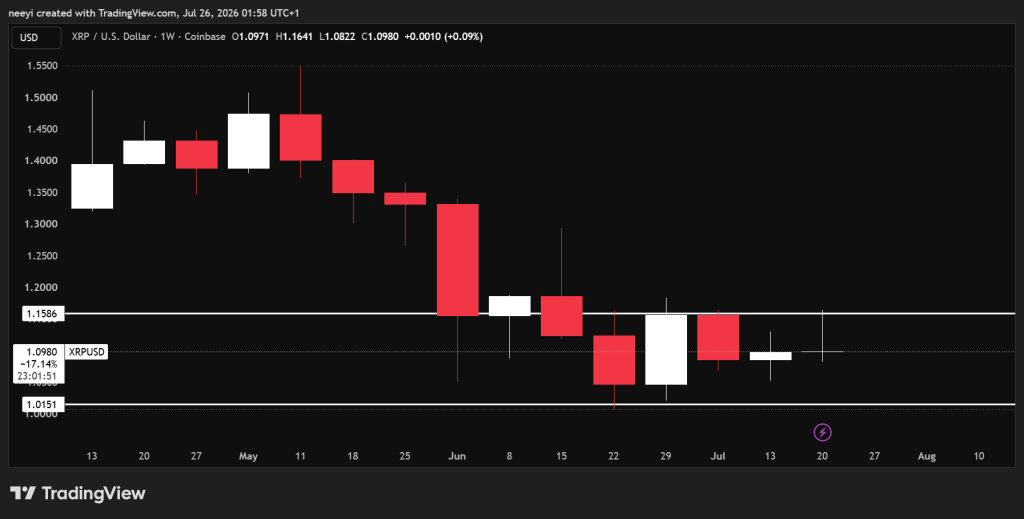 The XRP chart shows that weekly consolidation
If it continues to be rejected, the sideways structure will remain unchanged. XRP prices may continue to fluctuate between $1.08 and $1.15 until bitcoin, ETF funds flows or regulatory news provide a stronger catalyst. A weekly break below $1.08 would create a more bearish pattern, potentially pushing XRP to $1.00 and then opening up the possibility of a move towards $0.90.
XRP weekly indicators are still biased towards bearish
XRP's weekly indicators are still mostly bearish. All readings show weak momentum, so stronger demand for the token is still needed to make a sustained rebound more convincing.
Indicator readings
RSI (14) 34.005 Sell
MACD (12, 26) -0.223 Sell
Ultimate Oscillator 37.794 Sell
The RSI reading of 34.005 puts the XRP close to oversold territory, but no confirmed rebound signal has yet been issued. Buyers need to push the RSI higher to improve momentum. MACD remained negative at-0.223, indicating that short pressure was still controlling the broader weekly trend. The ultimate oscillator is at 37.794, which also gives a sell signal. This indicator measures trading pressure across multiple cycles, and the current value supports a cautious view.
These indicators do not guarantee further decline. However, all three are currently biased towards bearish proportions, indicating that XRP needs to clearly exceed $1.15 to reverse the situation.
XRP prices may follow three main scenarios in the coming week
Bullish XRP price forecast
XRP may hold the uptrend line and regain the $1.15 resistance level. If a breakthrough is confirmed, the price may exceed US$1.20 and then open the possibility of moving towards US$1.30. This scenario will be strengthened if Bitcoin stays above $64,000, XRP ETF flows improve, or there is a positive update to the Clarification Act.
Neutral XRP Price Forecast
XRP prices may continue to be trapped between $1.08 and $1.15. Bitcoin's continued consolidation and limited regulatory progress may keep the token within a six-week range. Repeatedly fluctuating between support and resistance will keep traders waiting for a confirmed breakthrough. Under this scenario, XRP may continue to hover around $1.10 next week.
Bearish XRP price forecast
XRP may fall below the uptrend line and lose $1.08 support. The first major downside target will appear around $1.008, before the focus shifts to $0.90. Bitcoin's fall below $60,000, further outflows from ETFs, or negative legislative news could all support this outcome.
FAQs
Is it better to own an XRP or an XRP ETF?
Choosing to hold the original XRP or XRP ETF depends on your preferences for account type, custody controls and fee structure. The main difference is that ETFs can provide tax-preferential access to retirement accounts, while original tokens have direct ledger effectiveness and zero management fees. Spot XRP ETFs, such as products from Bitwise and Canary Capital, can be traded at traditional U.S. brokerages.
What will the XRP reach after the Clear Act is passed?
If the Digital Asset Markets Clarity Act is passed, Consensus Financial analysts target predicting that XRP will initially be re-priced to $1.60 to $2.20, and may surge into the $5.00 to $10.00 range in subsequent months.






















