
 Exchange Ranking
 Top Exchanges
 24h Volume Ranking
 Popularity Ranking
 Exchange BTC Balance
 Proof of Reserves
 Decentralized Exchanges
 Funding Rate
 Funding Heatmap
 Liquidation Data
 Max Pain
 Long/Short Ratio
 Whale L/S Ratio
 Binance/Okex/Huobi L/S
 Bitfinex Margin L/S
 ETF Tracker
 Solana ETF
 XRP ETF
 Hong Kong ETF
 Bitcoin Treasuries
 Crypto Reversal
 Ethereum Reserves
 HyperLiquid Wallet Analysis
 Hyperliquid Whale Watch
 Large Transactions
 On-chain Movement
 Bitcoin ROI
 Stablecoin Market Cap
 Options Analysis
 News
News Articles
 Economic Calendar
 Features
 Wallet
 Contract Calculator


 Security
 Collections
 Watchlist
 Following
 SAND
SAND The Sandbox August 2026 price forecast: Can the expanding LAND ecosystem provide room for tokens to rebound, or will charts still dominate?
The Sandbox is planning a larger role for its Land site as its studio plans to launch a public release in the fourth quarter of 2026, when more monetization tools and reconstructed isometric maps will be launched. At the same time, after a long decline,$SAND is still trading below its daily downtrend line when entering August 2026. Behind this comparison: The Sandbox August 2026 price forecast-Can the expanding LAND ecosystem provide room for tokens to rebound, or will charts still dominate?
The preliminary judgment is neutral and short. If SAND breaks through its direct resistance level, the situation may improve, but the technical aspect is still weak.
Can greater Land practicality bring a new narrative to The Sandbox?
The Sandbox said that as its studio approaches public release in the fourth quarter of 2026, LAND will gain more practicality: greater game visibility, more monetization options, and ultimately LAND owners can run their own distribution business and curate games by other creators. Maps are also being rebuilt to isometric 3D for easier discovery. This is a developing story for The Sandbox ecosystem as it enters August, not a planned August catalyst. Expanding LAND's capabilities and increasing demand for SAND are two different things.
Are SAND traders planning for a rebound?
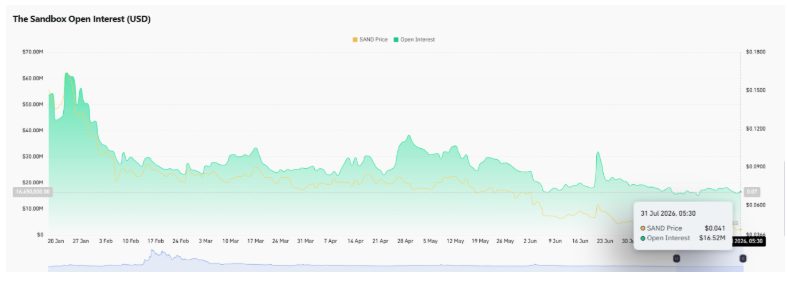
According to Coinglass data, the funding rate weighted by open positions is-0.0443%, which is negative and does not support a bullish interpretation. 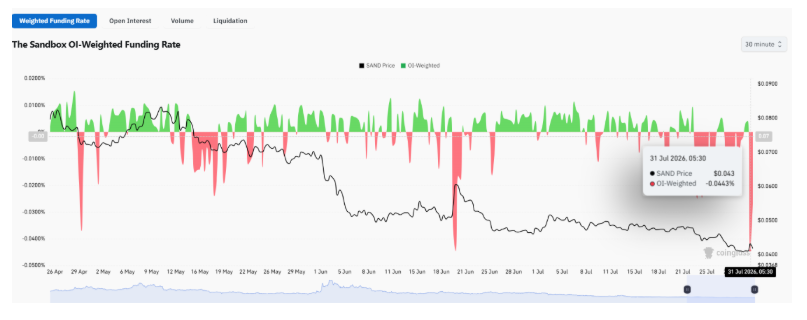 Open interest volume was US$16.52 million, well below higher levels earlier this year; speculative participation remained sluggish.
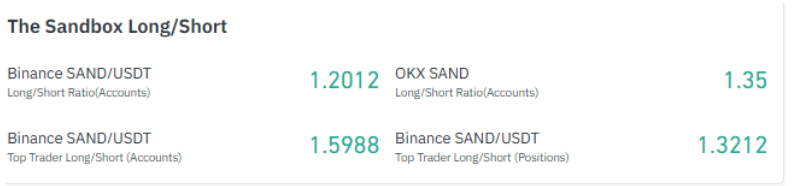
  Account positions are different: Binance's SAND/USDT ratio is 1.2012, OKX is 1.35, and Binance's top traders are as high as 1.5988 per account and 1.3212 per position. All of these are biased towards bulls, but combined with negative funding rates and lower open interest, the overall presentation is mixed signals rather than firm confidence.
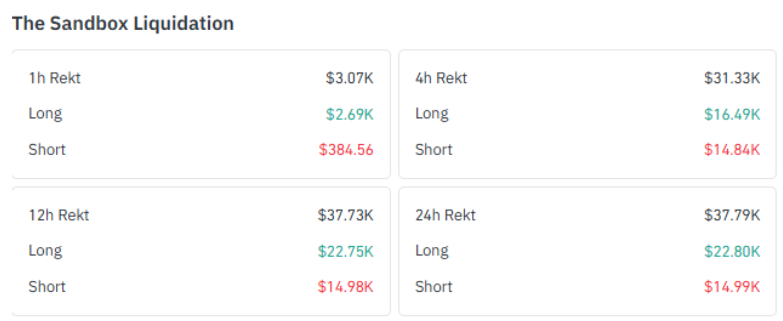
  The total 24-hour clearing was US$37,790, of which US$22,800 was cleared for long and US$14,990 was cleared for short-the bulls suffered a bigger blow, but the total was too small to trigger a chain clearing.
  SAND rose 1.95% in 24 hours, but still fell 10.05% in 30 days, 41.65% in 90 days, and 61.53% year-to-date. The latest rally has not repaired the broader decline. Data as of July 31, 2026, from Coinglass.
Can SAND break through the daily downtrend in August?
On the TradingView daily chart, SAND traded at around US$0.041790, below the downtrend line that has suppressed declines for months. 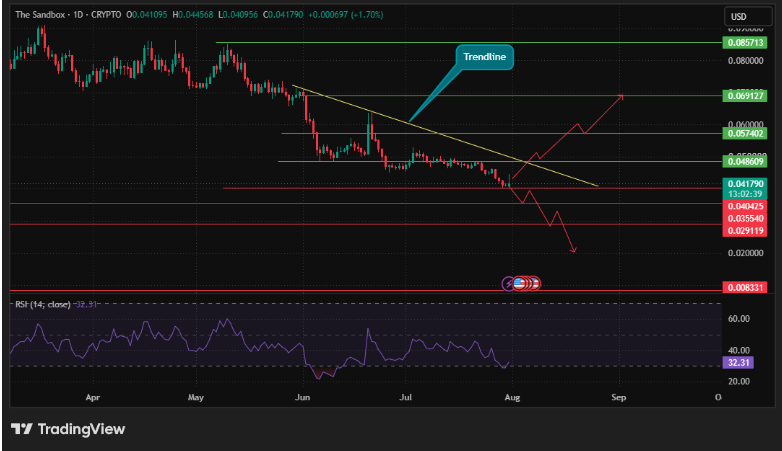 The trend line has not yet been breached; the paths above and below drawn on the chart are scenarios rather than facts that have occurred. The daily RSI is at 32.31, which is weak, close to oversold but has not yet been reached. For August, SAND technical analysis carries more weight than ecosystem headlines. The first important level in August was $0.048609. If you break through the trend line and stand firm at this level, it will improve the pattern and open up paths to $0.057402,$0.069127 and $0.085713-these are levels for subsequent markers, not what $SAND expects to achieve this month. The direct support level is US$0.040425, which is the most important level for the downside. Losing this position will turn attention to $0.035540, and $0.029119 below is another marker reference. The further position of $0.008331 on the chart is not the reality in August.
Is SAND oversold enough to challenge its weekly downtrend?
To zoom in,$SAND is trading at approximately US$0.041884, within a larger downtrend channel that defines its downtrend. 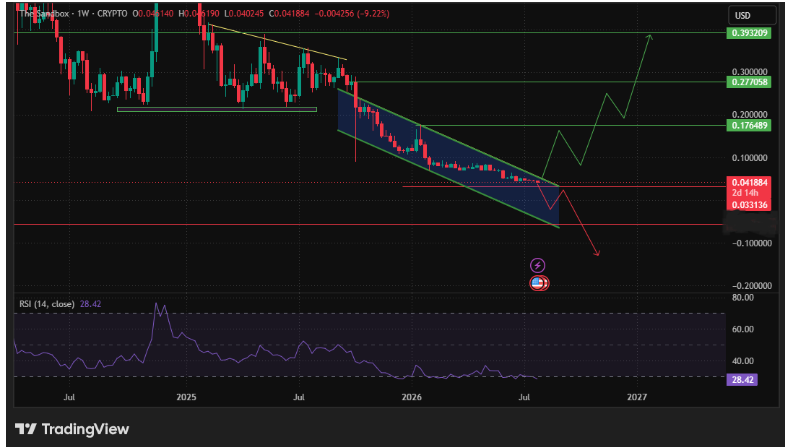 The channel remains intact; the bullish path drawn on the chart is a scenario rather than a confirmed trend. The weekly RSI was 28.42, which was below the regular 30 threshold and was technically oversold. But that doesn't mean a reversal is imminent; it means that momentum has been stretched further than usual, which may spark interest in a rebound, but does not guarantee a rebound. The effective weekly support below current prices is $0.033136. The upper area, with $0.176489,$0.277058 and $0.393209 as long-term resistance references, is a larger trend than August may achieve. For this month's SAND price outlook, the daily chart has more weight because its level is closer to the current price. Between unresolved daily trendlines, unbroken weekly channels and weak RSI readings on both time frames, SAND enters August neutral and empty, but if prices do move, there is a real but unconfirmed rally path.
The Sandbox August 2026 Price Forecast: Bullish, Benchmark, and Bearish Scenarios
Bullish Scenario: Confirmation Condition to Recover Daily Trend Line and Stand Above $0.048609; Concern Levels $0.057402,$0.069127,$0.085713; Failure conditions are failure to hold US$0.048609 and weekly channels remain intact.
Benchmark scenario: Maintain range volatility without clear break through US$0.048609 or fall below US$0.040425; range 0.040425-US$0.048609; failure condition is clear break through this range.
Bear scenario: Daily chart lost $0.040425; concern level was $0.035540, then $0.029119; expiration condition was $0.040425 recovered.
In addition to this table, the weekly chart also adds its own downward mark: a break below US$0.033136 would make the structural picture more severe than the daily chart alone shows.
What will confirm or weaken SAND's August trend?
As The Sandbox develops greater LAND utility, can SAND finally break through its downward trend? This update provides an ecosystem story as the project enters August, but the studio's public release is still an event in the fourth quarter of 2026 and is not something prices need to respond to this month. The chart has more weight here. $0.048609 is the key level to open up upside, while $0.040425 is the level that will maintain pressure if it falls. The oversold weekly RSI and improved daily structure leave room for a rebound in this The Sandbox price forecast, but this space will only materialize after the price is confirmed.






















