
 Exchange Ranking
 Top Exchanges
 24h Volume Ranking
 Popularity Ranking
 Exchange BTC Balance
 Proof of Reserves
 Decentralized Exchanges
 Funding Rate
 Funding Heatmap
 Liquidation Data
 Max Pain
 Long/Short Ratio
 Whale L/S Ratio
 Binance/Okex/Huobi L/S
 Bitfinex Margin L/S
 ETF Tracker
 Solana ETF
 XRP ETF
 Hong Kong ETF
 Bitcoin Treasuries
 Crypto Reversal
 Ethereum Reserves
 HyperLiquid Wallet Analysis
 Hyperliquid Whale Watch
 Large Transactions
 On-chain Movement
 Bitcoin ROI
 Stablecoin Market Cap
 Options Analysis
 News
News Articles
 Economic Calendar
 Features
 Wallet
 Contract Calculator


 Security
 Collections
 Watchlist
 Following
 ETH
ETH Ethereum prices present two possible paths: Will ETH hit $1000 first or $10000?
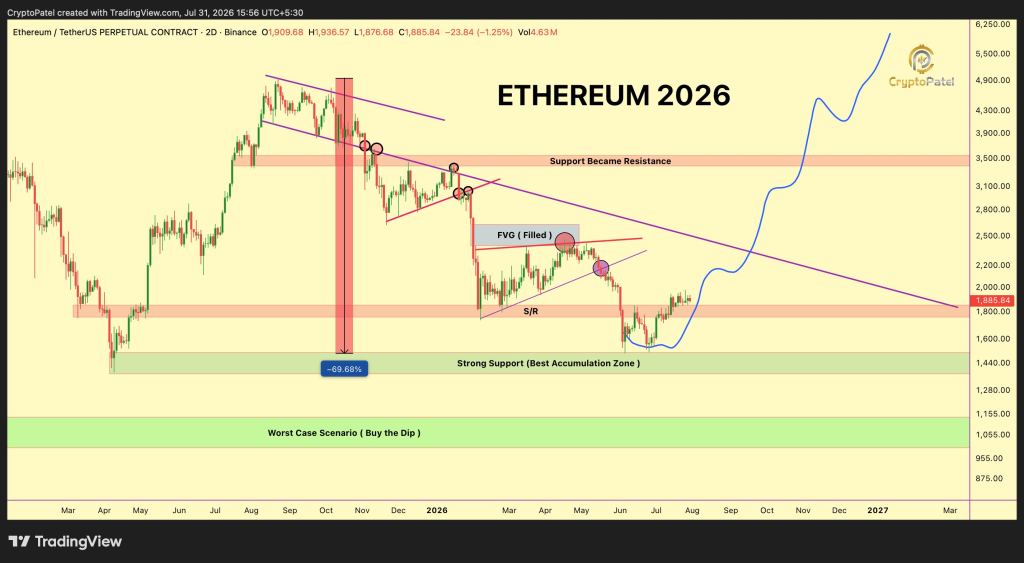
Ethereum prices have recovered from June lows, but Crypto Patel's chart shows that ETH has not yet deviated from its broader downward trend. There are still multiple technical resistance levels above the current price, and the reaction near these resistance levels will determine whether Ethereum embarks on a larger rebound or returns to its deepest support area.
The analyst's chart depicts two possibilities. After confirming a breakthrough, Ethereum may eventually climb to the $7000 to $10000 range. Failure near the main resistance area could bring ETH prices back to $1500 or even $1000.
Ethereum reached an all-time high of US$4,953.73 on August 24, 2025. Since then, ETH prices have fallen about 62% from their peak due to economic pressures and weakening market demand.
The sell-off intensified shortly after hitting a record high. Ethereum fell below $4100 in September, and subsequent profit-taking pushed the asset below the important $3000 mark. After several difficult months, ETH will close at around $2967 in December 2025.
At the beginning of 2026, the bearish market continued as recession concerns and changes in liquidity supply affected demand. Ethereum opened at about $2445 in January, and then fell to about $1472 in April.
Buyers defended in this low area, helping ETH rebound. Subsequently, Ethereum mainly remained between $1500 and $2000 in May and June. Inflows from the spot Ethereum ETF drove another rally in July, pushing ETH to near $1900.
Current direct resistance is between $1900 and $2000. A daily close above $2000 could open a path to a larger supply area of $2180 and $2400 to $2500.
Crypto Patel chart shows Ethereum is testing a downtrend line
Looking at Crypto Patel's Ethereum 2-day chart, you can see a downtrend line starting near the August 2025 high. Every major rally attempt has been blocked near that trend line, confirming that the broader bearish structure remains in effect.
When Crypto Patel released the chart, Ethereum was trading at approximately $1885. This price puts ETH close to the support/resistance area around $1750 to $1850. This zone has previously helped prevent deeper declines, although Ethereum must remain above it to protect the current rally.
The chart also shows that Ethereum recently filled a fair value gap around $2400 to $2500. Fair value gaps represent areas where prices have previously moved rapidly and trading activity has been limited. Markets sometimes return to these areas before choosing the next direction.
 @CryptoPatel / X
ETH hit the gap during the April rally but failed to hold the position. The refusal sent Ethereum back down to around $1500 in June. This failed attempt explains why Crypto Patel thinks $2400 to $2500 is the next key test.
Ethereum must recapture $2500 to confirm larger reversals
Crypto Patel pointed out that the $1500 to $1600 accumulation area has generated an increase of about 30%. Now his attention turns to higher resistance levels between $2400 and $2500.
Simply entering this area does not confirm a broader reversal. Ethereum needs a high trading volume breakthrough and the weekly closing price to stand firm above $2500 in order to gain stronger technical support for the bullish scenario.
The forecast path in the chart shows that ETH will break through its downtrend line after regaining $2500. Ethereum may then target around $3100 and then test the early support area around $3500.
After Ethereum lost the $3500 zone during its decline in 2025, the zone has become resistance. Retaking the area could open a path to around $4300 and previous historical highs of $4,953.73.
Crypto Patel believes that in the next cycle, the confirmed macro reversal could eventually push the Ethereum price to $7000 to $10000. His charts only illustrate possible paths based on current state of the art, so blue projections do not guarantee time or final goals.
Rejection from resistance may push ETH prices back towards $1000
The bearish scenario begins when Ethereum fails near $2400 to $2500. Another rejection could send ETH back to support near $1800 and then expose stronger areas between $1350 and $1500.
Crypto Patel marks that lower area on its chart as the strongest support level and preferred accumulation area. Ethereum previously rebounded in the region after falling nearly 70% from its 2025 high.
A serious economic or cryptocurrency-specific setback could push ETH below $1350. The chart places the worst-case support area around $1000 to $1100. Ethereum needs to fall below multiple established support levels for this goal to become realistic.
Ethereum's next move depends not only on a brief price increase. Trading volume must strengthen and ETH needs to close above $2500 on the weekly time frame. ETF funding flows, network needs and planned upgrades (such as Glamestead) may also affect the recovery.
Rejection near $2500 would keep the broader bearish structure unchanged. The confirmed breakthrough may make $3500 and previous historical highs within reach again. Ethereum now faces a technical test that may reveal whether $1000 or $10000 will become a more realistic goal.
FAQs
How much will an Ethereum cost in 2030?
Analysts '2030 price forecasts for Ethereum (ETH) vary widely depending on network adoption assumptions, ranging from a conservative $2300 to aggressive institutional targets of $22000 to $40000. Due to the highly speculative and volatile nature of the cryptocurrency market, there is no single consensus number.
Will ETH return to zero?
The possibility of zeroing is extremely low. The current transaction price is about US$1900. It has huge institutional support, a broad developer community and deep practicality as a smart contract platform. However, like all cryptocurrencies, their value depends on continued network adoption and macroeconomic conditions.






















