Exchange Ranking
 Top Exchanges
 24h Volume Ranking
 Popularity Ranking
 Exchange BTC Balance
 Proof of Reserves
 Decentralized Exchanges
 Funding Rate
 Funding Heatmap
 Liquidation Data
 Max Pain
 Long/Short Ratio
 Whale L/S Ratio
 Binance/Okex/Huobi L/S
 Bitfinex Margin L/S
 ETF Tracker
 Solana ETF
 XRP ETF
 Hong Kong ETF
 Bitcoin Treasuries
 Crypto Reversal
 Ethereum Reserves
 HyperLiquid Wallet Analysis
 Hyperliquid Whale Watch
 Large Transactions
 On-chain Movement
 Bitcoin ROI
 Stablecoin Market Cap
 Options Analysis
 News
News Articles
 Economic Calendar
 Features
 Wallet
 Contract Calculator


 Security
 Collections
 Watchlist
 Following
 ETH
ETH Ethereum network activity soared, and ETH prices remained stable at around US$1880.
From August 8 to 16, the number of new addresses on the Ethereum network climbed from 121,210 to 212,560 per day, marking a significant increase in network activity. A whale transferred 884.55 ETH (worth approximately $1.66 million) to two new wallets after exchanging 493.02 ETH for USDT. ETH prices remain above the $1860 support level, while the $1,920 - 1,960 range remains a key resistance area for a potential rebound.
Ethereum network activity jumped when ETH prices hovered around $1880, the number of new addresses increased, and a whale made a large transfer. Ali Charts data shows that the number of new ETH addresses per day has increased from 121,210 on August 8 to 212,560 today. Meanwhile, Onchain Lens tracked that 884.55 ETH had been transferred to two new wallets in the past day.
The number of Ethereum addresses has increased significantly
According to Ali Charts, Ethereum recorded 212,560 new daily active addresses today, 91,350 new addresses compared to 121,210 on August 8. Ali Charts describes network growth as an on-chain indicator of user adoption strength. The analyst also pointed out that historically sustained growth often precedes major price rallies. However, this increase in activity occurs at a time when ETH is still below recent highs. The four-hour chart shows that the price of ETH is US$1,879.47, and the latest K-line rose slightly by 0.01%.
Whale transfer 884.55 ETH
Onchain Lens reported that in the past day, a mysterious whale transferred 884.55 ETH to two new wallets, with a transfer value of approximately $1.66 million. Prior to this, the whale exchanged 493.02 ETH for 928,570 USDT through the CoW Protocol. The exchange involved approximately US$927,000 in ETH. The data provided did not disclose the identity of the whale or explain why it transferred funds. At the same time, ETH has maintained a narrow range after the recent correction.
ETH prices climbed from the range of around US$1,760 -1,800 to a high near US$1,960, then pulled back and entered the US$1,870 -1,900 range. The four-hour structure shows market momentum weakened after ETH hit around US$1,920 -1,930 between August 7 and 10. 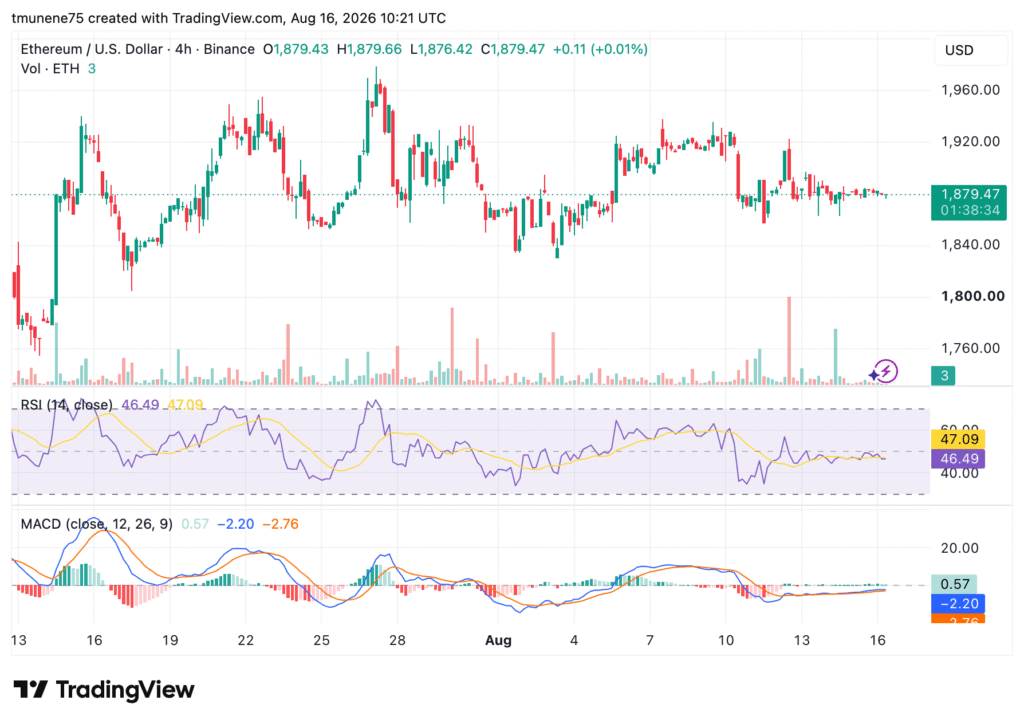
Prices then fell back to around US$1,860 -1,870 and stabilized in the small entity K-line. The RSI indicator is at 46.49, below its moving average of 47.09 and its neutral level of 50, but remains above 40. The MACD line is above the signal line but below the zero axis. Support is around $1,860 -1,840, followed by $1,800. Resistance appears around $1,900, then $1,920 -1,960. A breakthrough of $1,920 may suggest $1,960, while a break below $1,840 may suggest $1,800.