Exchange Ranking
 Top Exchanges
 24h Volume Ranking
 Popularity Ranking
 Exchange BTC Balance
 Proof of Reserves
 Decentralized Exchanges
 Funding Rate
 Funding Heatmap
 Liquidation Data
 Max Pain
 Long/Short Ratio
 Whale L/S Ratio
 Binance/Okex/Huobi L/S
 Bitfinex Margin L/S
 ETF Tracker
 Solana ETF
 XRP ETF
 Hong Kong ETF
 Bitcoin Treasuries
 Crypto Reversal
 Ethereum Reserves
 HyperLiquid Wallet Analysis
 Hyperliquid Whale Watch
 Large Transactions
 On-chain Movement
 Bitcoin ROI
 Stablecoin Market Cap
 Options Analysis
 News
News Articles
 Economic Calendar
 Features
 Wallet
 Contract Calculator


 Security
 Collections
 Watchlist
 Following
 ETH
ETH Ethereum prices hover in the $1900 region. There is currently an active short-term buying signal for ETH. Ethereum (ETH) is currently trading in the $1915 range, with a 24-hour range of $1892 to $1919, one of the narrowest trading ranges in recent weeks. In addition, the asset's trading volume was US$5.99 billion. Prices fluctuate little, but the structure underneath it deserves attention.
The asset is building the same compression pattern below $2000 as it previously lost upward support. The previous break caused prices to fall sharply. Again, another break from this level would point to $1300 as the next target. But the bullish reasons are equally true. The token is consolidating above the lows of the key macro range; if held, it will lay the foundation for a clearer upward trend. In addition to ETH prices, ETF demand, pledge activity and the Layer-2 ecosystem continue to consolidate fundamentals, regardless of the daily close.
Focus on the momentum of the Ethereum market
Hold on to the US$1850 mark and the ETH price structure remains good. Once it falls, the bearish situation will accelerate momentum towards previous lows. On the upside side, the POC line on the daily chart is the first obstacle. Breaking through this line,$2100 will be the next major resistance level. With momentum breaking through these two levels at the same time, Ethereum will transform into a complete bull market structure.
Four-hour technical analysis showed that Ethereum's moving average convergence divergence (MACD) line was above the signal line, indicating an active short-term buy signal. Both lines are above the zero line, and the bulls control the overall trend. However, the crossover is still trying to expand, and potential buying momentum is weak. The bar chart above the zero line is small, making it difficult for bulls to push up prices further. If the MACD line quickly falls back below the signal line, the current momentum will become a false breakthrough. 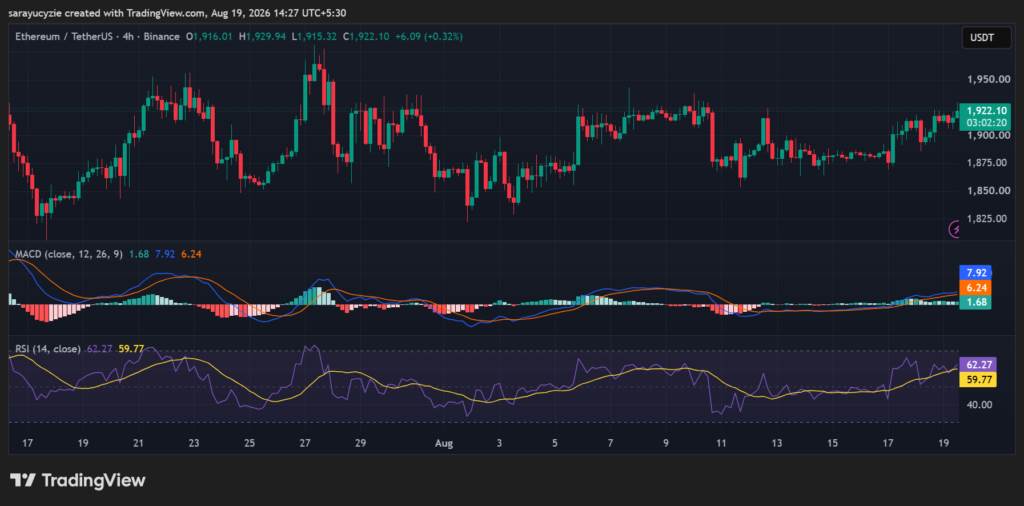
In addition, ETH's daily Relative Strength Index (RSI) read at 62.27, indicating strong bullish momentum, with buyers pushing prices upward. The index broke the neutral 50 threshold, confirming that buying volume exceeded selling pressure. In addition, it is below the overbought level. Values between 60 and 65 usually indicate stable and sustainable buying confidence. The trend is clearly in favor of bulls, and there is still plenty of room for growth before reaching overbought territory.
Highlights in the cryptocurrency market
The U.S. Securities and Exchange Commission (SEC) announces regulation of cryptoassets, providing new avenues for cryptocurrency financing.