Exchange Ranking
 Top Exchanges
 24h Volume Ranking
 Popularity Ranking
 Exchange BTC Balance
 Proof of Reserves
 Decentralized Exchanges
 Funding Rate
 Funding Heatmap
 Liquidation Data
 Max Pain
 Long/Short Ratio
 Whale L/S Ratio
 Binance/Okex/Huobi L/S
 Bitfinex Margin L/S
 ETF Tracker
 Solana ETF
 XRP ETF
 Hong Kong ETF
 Bitcoin Treasuries
 Crypto Reversal
 Ethereum Reserves
 HyperLiquid Wallet Analysis
 Hyperliquid Whale Watch
 Large Transactions
 On-chain Movement
 Bitcoin ROI
 Stablecoin Market Cap
 Options Analysis
 News
News Articles
 Economic Calendar
 Features
 Wallet
 Contract Calculator


 Security
 Collections
 Watchlist
 Following
 ADA
ADA Cardano is at a critical juncture
ADA prices previously exceeded $0.22, hitting $0.22303, and then quickly fell back. This refusal to rise put pressure on the bullish structure on the previous 4-hour chart.
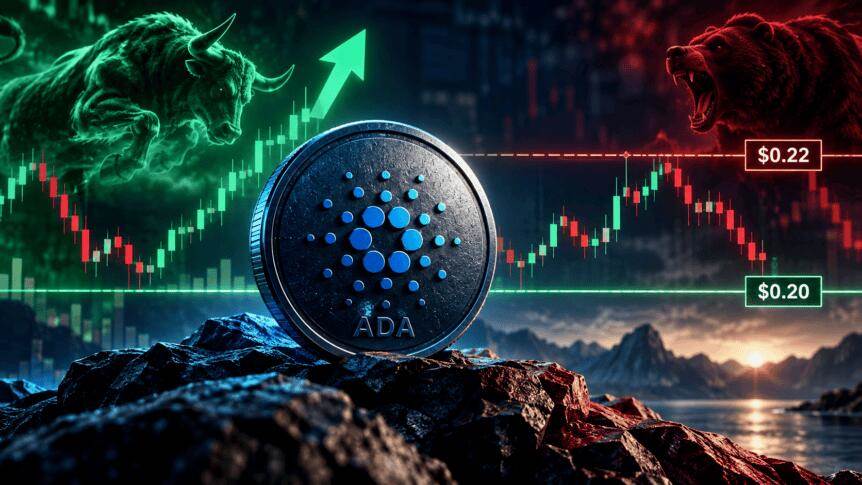
Currently, two prices are the most critical: the upper resistance is $0.22 and the lower support is $0.20.
Core Points
ADA encountered strong resistance at $0.22, and although it hit a high of $0.22303, it later retreated to $0.218. The bullish pattern on the 4-hour chart is under threat as the ADA fails to remain above the resistance level of $0.22045 and below the 9 EMA of $0.21964. The RSI on the 4-hour chart fell to 49.95, indicating that short-term buying pressure has weakened. Only when the ADA can regain its footing and remain above $0.22 will the previously formed top-down pattern continue to be effective. If it exceeds $0.22, ADA will enter the $0.24-$0.26 range, with a target price of approximately $0.34. Support is at $0.20, and if it breaks below this level, ADA may fall further to $0.18-$0.16.
According to Glassnode data, ADA's market value fluctuates between $7.4 billion and $8.4 billion as prices fluctuate between $0.20 and $0.22. ADA's next major price changes are expected to be achieved by breaking above $0.22 or falling below $0.20.
ADA prices are difficult to exceed $0.22
Analysis of the ADA chart shows that buyers have made strong attempts to break through the $0.22 resistance level. On the 4-hour chart, ADA rose from approximately $0.16 to $0.22303. The current candle line opens at $0.22155, hitting a high of $0.22303, falling back to a low of $0.21742, and the current trading price is $0.218. This forms a very obvious rejection signal at the resistance level of $0.22045.
In addition, the ADA is also below the 9 EMA of $0.21964. The RSI also gave a similar signal: the 4-hour RSI dropped from 53.62 to 49.95, returning to below the 50 mark. Therefore, for buyers to regain control of the situation, the ADA must rise above $0.22045 and then exceed $0.22303.

Bullish pattern needs to be confirmed
In a post on platform X, the 4-hour chart shows a top-down pattern. The head is formed in the range of $0.10-$0.12, and the right shoulder develops in the range of $0.16-$0.18. The neckline is around $0.22.


$ADA prints the standard inverted head and shoulder shape

The right shoulder performs strongly, and the buyer defends at the neckline near $0.22. As prices push into resistance, momentum is shifting in a bullish direction. If we can break through the neckline cleanly and cleanly, it will open up the path to a higher goal for... -- Crypto With Gopal (@cryptowithgopal) September 9, 2026
This form provides a potential target price for bulls, i.e. a measurement target of approximately $0.34. The calculation is simple: the distance from the $0.10 head to the $0.22 neckline is approximately $0.12. Add $0.22 to this distance to get a target price of approximately $0.34.
But there is an important condition here: ADA needs to remain above the $0.22 neckline for the target price to be effective. A pullback towards $0.218 means a breakthrough has not yet been confirmed.
Daily chart focuses on $0.2186
Daily chart highlights the importance of the $0.22 area. The ADA trading price is around $0.2186, almost right at the marked resistance level of $0.21861. This level rejected price increases in multiple attempts in May-June and August 2026.

Cardano 1D chart
There are still some positive technical indicators. The ADA is above the daily 9 EMA ($0.21556) and the RSI has climbed from 56.25 to 58.54. The RSI is also below 70, so the market has not yet entered overbought territory.
However, the larger trend remains bearish as the ADA remains below the main downward resistance line. Therefore, a daily close of $0.2186-$0.22 is more important than a brief break through this level.
$0.20 is the key level that bulls cannot lose
Glassnode's data also firmly brings the $0.20 level into view. Data shows that as ADA prices move between $0.20 and $0.22, its market value fluctuates between approximately $7.4 billion and $8.4 billion. This means that within the $0.02 price range, the market value difference is approximately $1 billion.

Cardano's market capitalization
For ADA,$0.20 is now a key support level. If the level is defended, the price may remain in the $0.20-$0.22 range and try to resist again.$ 0.20 A break below will bring $0.18-$0.16 back into consideration. If ADA can break through $0.22 and stand firm, the next target level will be $0.24-$0.26,$0.30, and possibly even $0.34.
Currently, ADA prices are hovering between resistance and support. Once it is confirmed that a breakthrough of $0.22 will boost the hopes of bulls; while a break below $0.20 will greatly weaken the confidence of bulls.