
 Exchange Ranking
 Top Exchanges
 24h Volume Ranking
 Popularity Ranking
 Exchange BTC Balance
 Proof of Reserves
 Decentralized Exchanges
 Funding Rate
 Funding Heatmap
 Liquidation Data
 Max Pain
 Long/Short Ratio
 Whale L/S Ratio
 Binance/Okex/Huobi L/S
 Bitfinex Margin L/S
 ETF Tracker
 Solana ETF
 XRP ETF
 Hong Kong ETF
 Bitcoin Treasuries
 Crypto Reversal
 Ethereum Reserves
 HyperLiquid Wallet Analysis
 Hyperliquid Whale Watch
 Large Transactions
 On-chain Movement
 Bitcoin ROI
 Stablecoin Market Cap
 Options Analysis
 News
News Articles
 Economic Calendar
 Features
 Wallet
 Contract Calculator


 Security
 Collections
 Watchlist
 Following
 BTC
BTC  ETH
ETH Key Points
On Friday, the Ethereum ETF had a net outflow of US$70.26 million, ending five consecutive days of capital inflows.
Weekly performance remained positive, with a net inflow of Ethereum ETF of US$103.9 million, achieving positive growth for the third consecutive week.
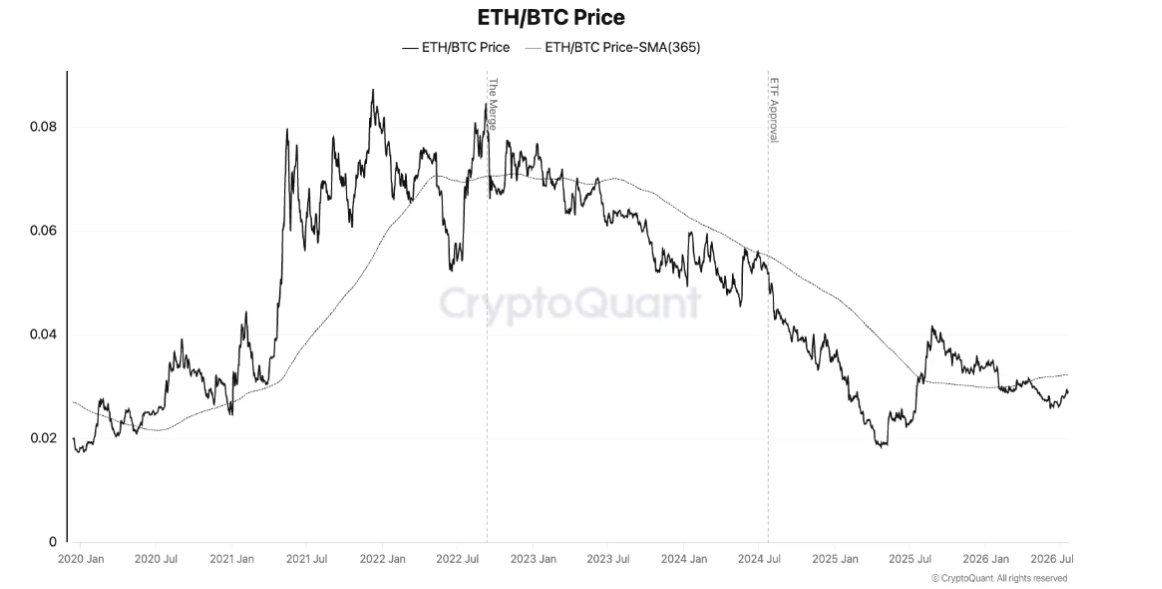
The ETH/BTC ratio fell to 0.028, the lowest level since August last year.
Blockchain data shows that ETH's current price is below its collective cost benchmark of US$2304, a condition that typically consumes selling pressure.
Key floor indicators, such as MVRV and exchange deposit volumes, have not yet reached the extreme thresholds that typically mark a clear price bottom.
On-chain evidence for the bottom shape of Ethereum
Ethereum (ETH) closed at US$1837 this week, with a net outflow of US$70.26 million from the U.S. spot Ethereum ETF on Friday (July 25). This marked the end of five consecutive days of net inflows (cumulative US$211.25 million) from July 17 to July 24.
Although Friday's data reversed, broader weekly data remained optimistic, with cumulative net inflows of Ethereum ETF of US$103.9 million. This is the third consecutive week that a net inflow of funds has been achieved. Throughout July, the total cumulative net inflow of Ethereum ETF reached US$337.74 million.
Bitcoin ETF also showed a similar trend, with a net outflow of US$240.08 million on Friday, ending seven consecutive days of net inflows. BTC prices were just below $64,000, falling back from Tuesday's weekly high of $66,892.
Market analyst Ted commented on social media that ETH remains above key support levels. He pointed out that Ethereum shows a strong trend relative to Bitcoin and believes that the current upward momentum may not have been exhausted.
ETH fell sharply from the all-time high of US$4946 set last year, falling to US$1400 in June before stabilizing and recovering. The current price of the cryptocurrency is approximately 17% lower than its realized price (the average on-chain holding cost of all ETH tokens) of US$2304.
On-chain data: The bottom signal is beginning to appear
The CryptoQuant analysis report released on Thursday pointed out that Ethereum shows initial signs of a market bottom, but has not yet met all the conditions necessary to confirm a continued upward trend.
Source: CryptoQuant
The ETH/BTC ratio has shrunk to 0.028, the lowest level since August last year. Although this weak performance relative to Bitcoin has historically often heralded a major altcoin market that will follow, market observers emphasize that more confirmation signals are still needed.
The MVRV ratio of ETH/BTC has dropped from 0.95 in August last year to approximately 0.65. According to CryptoQuant's research, a reliable bottom usually occurs when this indicator breaks below 0.45, a threshold that occurred in 2019-20 and early 2025.
Key technology prices of ETH
Ethereum is currently challenging its 20-day exponential moving average ($1839) and 50-day exponential moving average ($1831). A clear break below these technical indicators could expose support areas around $1806, followed by $1741.
In the past 24 hours, ETH has liquidated approximately US$67.79 million, of which long positions accounted for US$44.18 million.
However, one indicator is currently suggesting a bottom is forming. The relative spot trading volume of ETH/BTC has shrunk to about 0.5 from 1.75 in August, a threshold that historically coincides with the bottom of the Ethereum price.
Institutional demand for ETFs also showed signs of change. The ETH/BTC ETF holding ratio climbed to 0.13 in July after falling to 0.115 in June.






















