Exchange Ranking
 Top Exchanges
 24h Volume Ranking
 Popularity Ranking
 Exchange BTC Balance
 Proof of Reserves
 Decentralized Exchanges
 Funding Rate
 Funding Heatmap
 Liquidation Data
 Max Pain
 Long/Short Ratio
 Whale L/S Ratio
 Binance/Okex/Huobi L/S
 Bitfinex Margin L/S
 ETF Tracker
 Solana ETF
 XRP ETF
 Hong Kong ETF
 Bitcoin Treasuries
 Crypto Reversal
 Ethereum Reserves
 HyperLiquid Wallet Analysis
 Hyperliquid Whale Watch
 Large Transactions
 On-chain Movement
 Bitcoin ROI
 Stablecoin Market Cap
 Options Analysis
 News
 Articles
 Economic Calendar
 Features
 Wallet
 Contract Calculator


 Security
 Collections
 Watchlist
 Following
 BTC
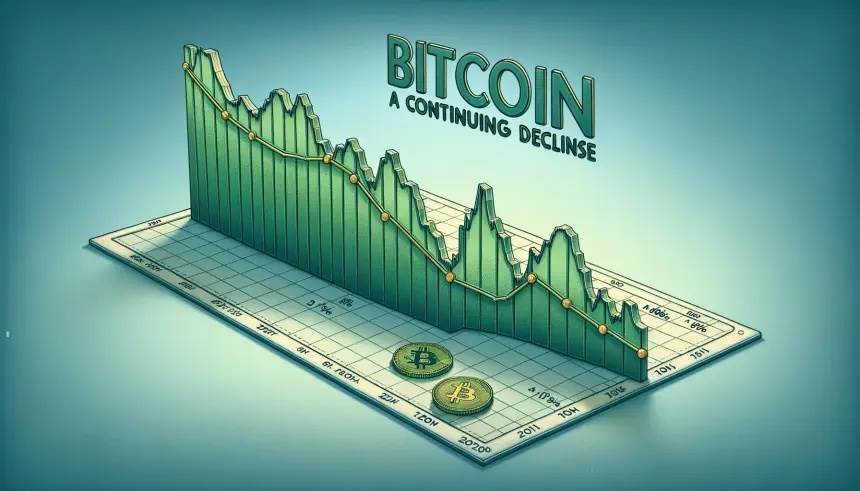
比特币价格未能回升至96,500美元上方。BTC已下跌超过3%,并且有可能进一步跌破92,000美元。
● 比特币价格再次下跌,跌破95,000美元和94,500美元。
● 目前价格低于98,000美元和100小时简单移动平均线。
● 在BTC/USD小时图上,一条看跌趋势线正在形成,阻力位在96,600美元(数据来自Kraken)。
● 如果该货币对跌破92,500美元区域,则可能继续下跌。
比特币价格进一步下跌
比特币价格未能守住95,500美元的关键支撑位。空头在95,500美元下方持续活跃,并推动价格走低。
空头力量增强,成功将价格压低至94,000美元以下。价格在92,890美元附近形成低点,目前在近期从103,998美元高点跌至92,890美元低点的23.6%斐波那契回撤位附近盘整。
比特币目前交易价格低于95,000美元,也低于100小时简单移动平均线。此外,BTC/USD小时图上正在形成一条下降趋势线,阻力位在96,600美元。
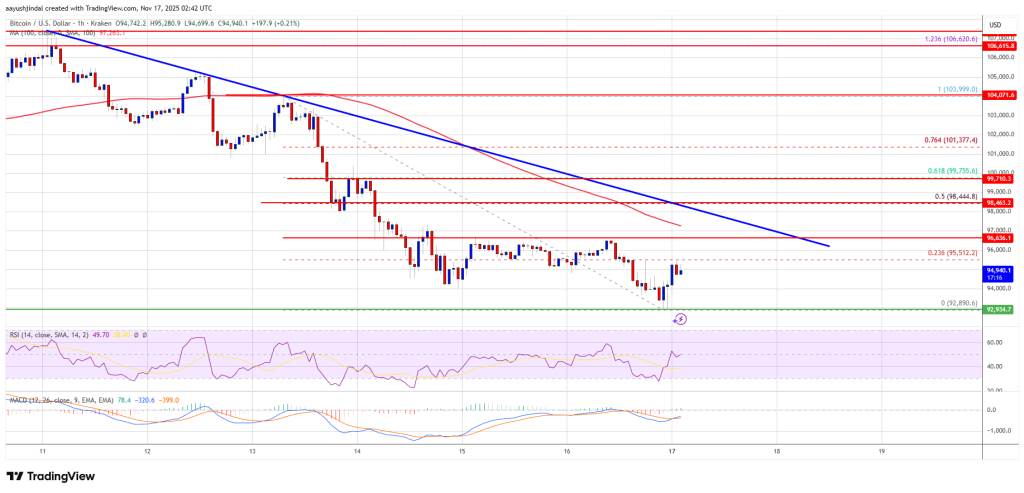
来源:TradingView.com上的BTCUSD
如果多头试图发起新一轮反弹,价格可能在95,500美元附近遇到阻力。第一个关键阻力位在96,500美元附近,靠近趋势线。下一个阻力位可能是97,200美元。如果收盘价高于97,200美元阻力位,价格可能会进一步上涨。在这种情况下,价格可能会上涨并测试98,500美元阻力位。任何进一步的上涨都可能将价格推向99,500美元。多头的下一个障碍可能是100,000美元和100,500美元。
比特币还会继续亏损吗?
如果比特币未能突破96,600美元的阻力位,则可能开始新一轮下跌。直接支撑位在93,500美元附近。第一个主要支撑位在92,500美元附近。
下一个支撑位在91,500美元附近。如果价格继续下跌,短期内可能会下探至90,000美元的支撑位。主要支撑位在88,500美元,如果跌破该支撑位,比特币短期内可能会加速下跌。
技术指标:
● 小时MACD指标——MACD指标目前在看跌区域加速走低。
● 小时相对强弱指数(RSI)–BTC/USD的RSI目前低于50水平。
● 主要支撑位–92,500美元,其次是90,000美元。
● 主要阻力位——95,500美元和96,600美元。