Exchange Ranking
 Top Exchanges
 24h Volume Ranking
 Popularity Ranking
 Exchange BTC Balance
 Proof of Reserves
 Decentralized Exchanges
 Funding Rate
 Funding Heatmap
 Liquidation Data
 Max Pain
 Long/Short Ratio
 Whale L/S Ratio
 Binance/Okex/Huobi L/S
 Bitfinex Margin L/S
 ETF Tracker
 Solana ETF
 XRP ETF
 Hong Kong ETF
 Bitcoin Treasuries
 Crypto Reversal
 Ethereum Reserves
 HyperLiquid Wallet Analysis
 Hyperliquid Whale Watch
 Large Transactions
 On-chain Movement
 Bitcoin ROI
 Stablecoin Market Cap
 Options Analysis
 News
News Articles
 Economic Calendar
 Features
 Wallet
 Contract Calculator


 Security
 Collections
 Watchlist
 Following
 BTC
BTC Bitcoin seems to be starting a new day of trading at an extremely awkward price. BTC is currently trading at about $63,000, after U.S. investors sold again, sending it down from around $63,800 to $62,900.
The reason why this situation attracts attention is that the same pattern has appeared for four consecutive trading days. Bitcoin can rebound outside U.S. trading hours, but once U.S. trading begins, it will encounter a new round of selling.
Meanwhile, Bitcoin's broader ecosystem is facing another problem. The Bitcoin Red Team used cutting-edge AI to scan almost the entire open source ecosystem and reported multiple critical and high-severity vulnerabilities.
BTC price movement-phased structure
However, when you look more closely at the Bitcoin chart, recent trends become quite clear. The 4-hour chart, which shows the time range from June 1 to August 13, shows how BTC prices began to fall from a significant low in June, then rebounded strongly in mid-July, and then gave up some of the gains since then.
The first important fluctuation occurred at the end of June, when the price of Bitcoin fell to US$57,758, the lowest point on the chart and became the basis for a subsequent rally. BTC climbed sharply from there, reaching $67,255 in mid-July. 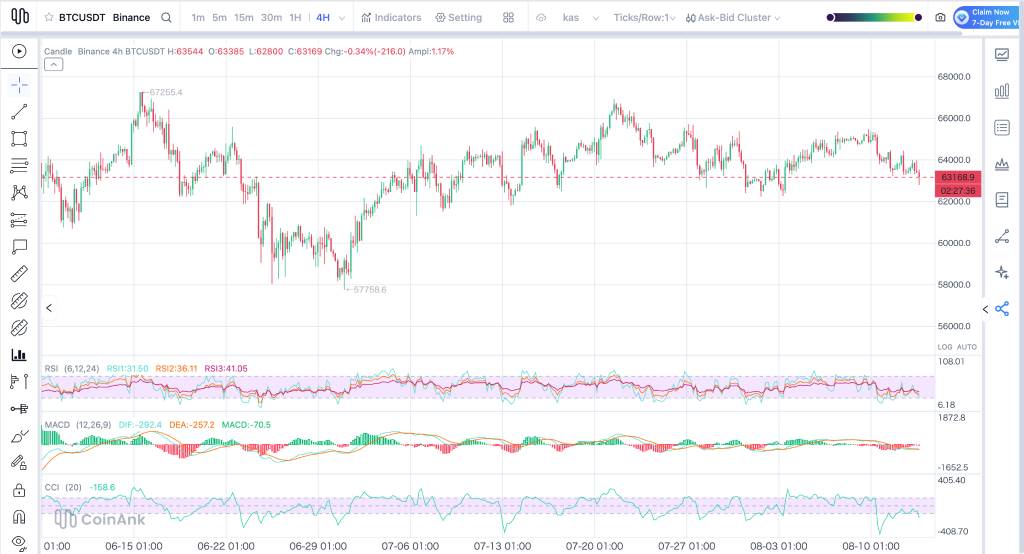 Source: CoinAnk
It was an excellent rally, but buyers failed to maintain prices at that level. After climbing to local highs, cryptocurrencies began to form a series of lower highs, indicating that upward momentum is weakening.
Since then, BTC has continued to move sideways or even fall. This latest development is even more worrying because cryptocurrencies have fallen below the structural support level of $63,500 and traded at $63,169, down 0.34% during the day. This means BTC is currently trading below a support level that previously served as a bottom in the 4-hour chart.
Current trend:
Cryptocurrency traded at US$63,169 after falling below the US$63,500 support level. The next range I focus on is $60,000 -62,000, which is part of the broader support area that formed during the June correction.
Support and resistance areas:
Level Type Remarks
US$67,255 The main resistance was local high in mid-July
US$63,500 has broken support/resistance has previously lost structural bottom
63,000-63, US$500 pivot area immediate area where BTC needs to recover
US$62,000 supports the first major downside level
US$60,000 -62,000 mainly supports the broader June support area
57, The $758 mainly supports the June swing lows
The level traders are currently focusing on is $63,500. Bitcoin has fallen below that level, so returning to this level will give buyers some room to rebound. If BTC remains below $63,500, the next major test will be around $62,000.
Indicators:
RSI (6, 12, 24): Short-term RSI1 is 31.50, medium-term RSI2 is 36.11, and long-term RSI3 is 41.05. The fast RSI is close to the traditional oversold level of 30, indicating the extent to which selling pressure affects BTC. The other two readings also remained low, maintaining short momentum.
MACD (12, 26, 9): DIF is-292.4, DEA is-257.2. The bar chart remains significantly negative, indicating that sellers continue to control the current trend. There are no signs of a golden cross here either.
CCI (20): CCI is-158.6, which is lower than the oversold level of-100. As a result, CCI is in oversold territory, consistent with the strong selling pressure observed in Bitcoin prices.
Looking at the larger picture, Bitcoin climbed from a June low of $57,758 to $67,255 in mid-July, before its rally momentum began to wane. BTC has since formed a series of lower highs and has now fallen below the US$63,500 support level. Starting from here, there are two main possibilities.
BTC prices may find buyers in the $62,000 -62,500 range, triggering a rally towards $63,500. Recovering that support would give buyers the opportunity to try to break through $64,000 again.
Another possibility is that sellers remain in control and BTC falls below $62,000. This will bring the broader $60,000 -62,000 support area into view, with a June low of $57,758 becoming the next major downside target.
For me,$63,500 is still the key level. Bitcoin needs to recover that position to repair its recent break. If BTC stays below it and then falls below $62,000, the path to June lows will become more open.
Bitcoin security ushers in AI reality test
Price trends are just part of the current Bitcoin story. According to reports, CalleBTC, a member of the Bitcoin Red Team, said that the team spent about two weeks using cutting-edge AI to scan almost the entire Bitcoin open source ecosystem for vulnerabilities.
The team reported a large number of critical and high-severity findings, many of which have been verified by maintainers. The Lightning Network project has received special attention due to its complexity. CalleBTC also warned that bitcoin-related projects that are no longer actively maintained should be considered potentially vulnerable until they undergo appropriate security testing.
The bigger problem is the speed at which AI analyzes code. Human researchers need to spend time carefully combing through these codebases, and AI can analyze large amounts of code very quickly. This does not mean that Bitcoin itself is flawed. These findings also apply to other open source projects. In fact, the Red Team sees this process as a way to identify weaknesses and make the ecosystem stronger.
Today's Bitcoin Price Forecast
Bitcoin prices are currently testing the $63,000 region after selling off for four consecutive U.S. trading sessions.
Bullish scenario: If BTC regains $64,000 and stays above that level during U.S. trading hours, the recent selling pattern will begin to lose credibility. This could bring the $64,800 -65,000 range back into view.
Neutral scenario: Bitcoin may continue to fluctuate between $63,000 and $64,000, giving buyers and sellers time to determine a clearer direction.
Bear scenario: Continued lows below US$63,000 will put the US$62,000 -62,900 range into focus. Losing this area would open the door to a broader $60,000 -62,000 support area.
My opinion: The ones I am most concerned about right now are $63,000 and $64,000. Repeated selling during U.S. trading hours is clearly visible in the 1-hour data, but calling it manipulation requires more evidence from order flow and institutional data. If BTC returns to US$64,000, the short-term trend will improve. If $63,000 falls, Bitcoin prices may have more room to fall.
Frequently Asked Questions
Is Bitcoin currently oversold? Yes. The short-term RSI is 31.50, close to the traditional oversold threshold of 30, while the CCI is deeply oversold at-158.6. These readings indicate strong selling pressure, but may also leave room for a short-term rebound.
Can Bitcoin rebound from $62,000? Yes. The $62,000 -62,500 area may attract buyers, especially with oversold readings from RSI and CCI. A rebound from the region could bring BTC back to $63,500.