Exchange Ranking
 Top Exchanges
 24h Volume Ranking
 Popularity Ranking
 Exchange BTC Balance
 Proof of Reserves
 Decentralized Exchanges
 Funding Rate
 Funding Heatmap
 Liquidation Data
 Max Pain
 Long/Short Ratio
 Whale L/S Ratio
 Binance/Okex/Huobi L/S
 Bitfinex Margin L/S
 ETF Tracker
 Solana ETF
 XRP ETF
 Hong Kong ETF
 Bitcoin Treasuries
 Crypto Reversal
 Ethereum Reserves
 HyperLiquid Wallet Analysis
 Hyperliquid Whale Watch
 Large Transactions
 On-chain Movement
 Bitcoin ROI
 Stablecoin Market Cap
 Options Analysis
 News
News Articles
 Economic Calendar
 Features
 Wallet
 Contract Calculator


 Security
 Collections
 Watchlist
 Following
 DOT
DOT Polkadot (DOT) Price Forecast: Critical Consolidation After Channel Breakout
DOT had been sliding for several months in the declining channel before achieving a breakthrough with a big positive line in the previous trading session. This trend usually means that the market will enter a consolidation rather than a straight continuation of gains, which is the case on the current chart-prices pause above key levels. Any reality-based Polkadot price forecast must start from this consolidation stage, rather than just relying on that one to break through the positive line.
What is the current market valuation of Polkadot?
According to CoinMarketCap data, the current trading price of $DOT is approximately US$0.8725, up 2.96% in 24 hours. 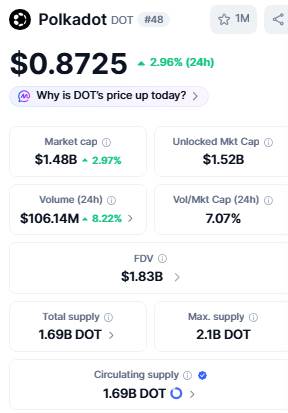 The market value is approximately US$1.48 billion, with a fully diluted valuation of US$1.83 billion. The circulation supply is 1.69 billion DOT units, and the maximum supply is 2.1 billion units. About 80% have entered circulation. The 24-hour trading volume is US$106.14 million, an increase of 8.22%, which provides a scale background for this Polkadot price forecast.
What votes has the DOT DAO passed recently?
A new data point was added to the governance level this week. According to Polkadot's official X account, Wish for Change #1926 proposal has been supported by the DAO, which includes: destroying all DOT received in future $JAMKB sales in full instead of transferring it to the treasury; and opposing the distribution of $JAMKB through grants or loans at below-market interest rates. 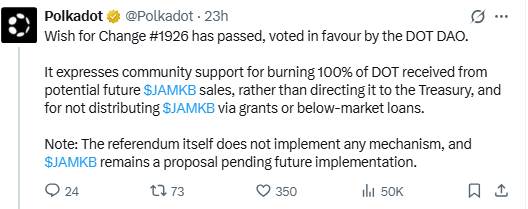 The referendum itself did not implement a specific mechanism, but it sent a signal of a deflationary tendency, indicating how the community hopes to handle future token flows.
Has the derivatives market confirmed this trend?
Derivatives data provides more background information. According to Coinglass data, DOT has risen 2.82% in the past 24 hours, 10.46% in seven days, and 15.07% in one month, but the 90-day and 180-day windows are still deeply negative at-28.14% and-45.51% respectively. 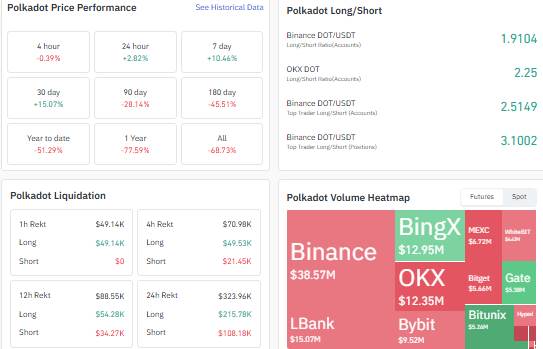 The long-short ratio is seriously biased towards the long. The ratio of top Binance traders exceeds 3 based on the size of their positions. This bias also comes at a cost: the total 24-hour clearing amount was approximately US$323,960, most of which was long clearing, with futures trading concentrated in Binance.
 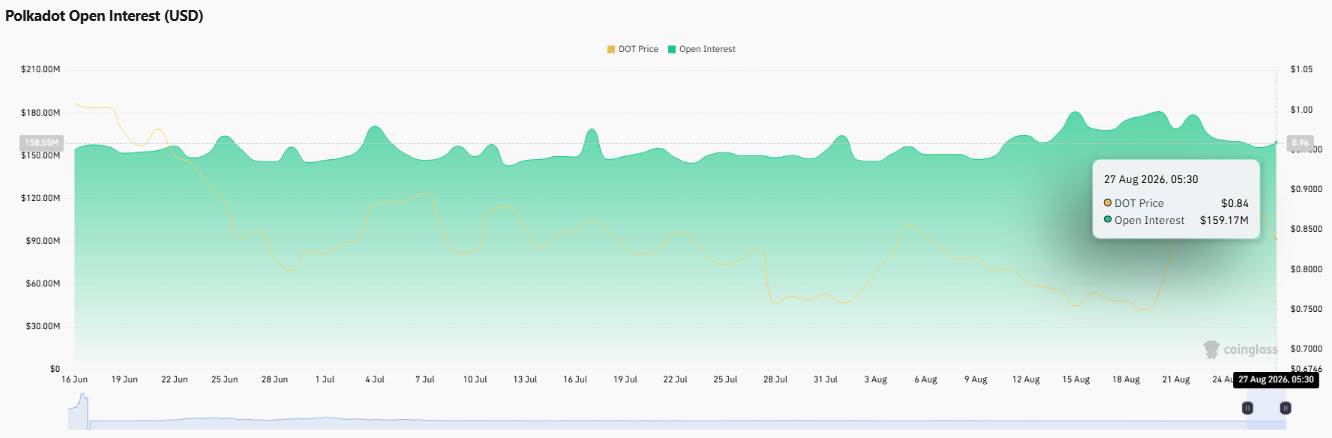 Open interest has risen to approximately US$159.17 million, near its highest level in several weeks.
What is the distribution of DOT's supply along the chain?
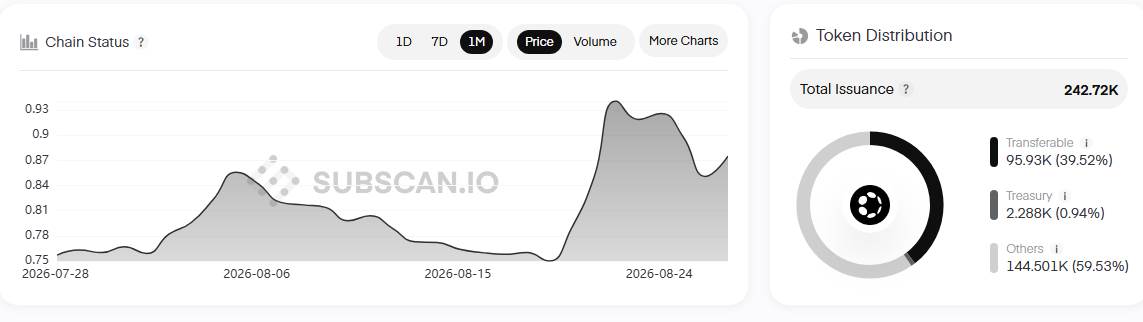 On-chain issuance data shows that DOT's current supply is divided into three parts: approximately 39.52% is transferable, 0.94% is held by the treasury, and the remaining 59.53% is used for other allocations such as pledges and reserves.
How might DOT develop next?
Before analyzing the DOT daily chart, the following is a list of possible evolution paths for different Polkadot price forecast scenarios.
Market conditions
Trigger conditions
Key prices
Bully
Daily closed firm above 0.8704 and broke through the consolidation zone
0.8704 -> 1.0394 -> 1.1844
Neutral
Prices are sideways in the near term range
0.8704 - 1.0394
Bear
Daily closed below support
0.7964 -> 0.7273
Can DOT's daily chart confirm its channel breakthrough?
The clearest interpretation comes from the daily chart. DOT broke through the downtrend channel that had lasted for months with a big positive line in the last trading session. According to the chart, the price is currently above the 0.8704 support level to take a breather, absorb this breakthrough trend and wait for the next direction to choose. 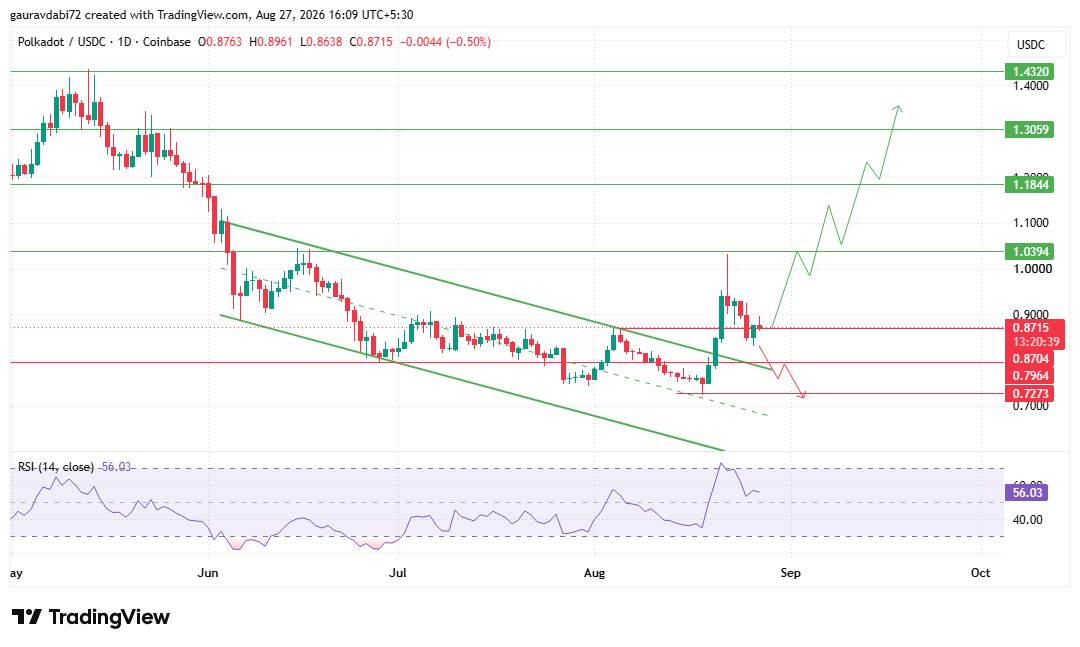 If the daily line closes firmly above 0.8704, the current structure remains constructive, and the range from 0.8704 to 1.0394 will be the key observation range before it is possible to move towards 1.1844. If the close falls below 0.8704, the focus will move down to 0.7964 and then 0.7273. The RSI indicator on the 14th was 56.03, which was in a neutral to moderately bullish range after exiting recent lows, consistent with the market's cooling but not turning bearish.
How do analysts view the current landscape?
Analysts believe that channel breakthrough attempts, long-biased position structures with liquidation risks, and deflationary governance votes provide a constructive background for this Polkadot price forecast. However, this pattern can only turn into a decisive signal after the daily close confirms that it has stabilized above 0.8704.