Exchange Ranking
 Top Exchanges
 24h Volume Ranking
 Popularity Ranking
 Exchange BTC Balance
 Proof of Reserves
 Decentralized Exchanges
 Funding Rate
 Funding Heatmap
 Liquidation Data
 Max Pain
 Long/Short Ratio
 Whale L/S Ratio
 Binance/Okex/Huobi L/S
 Bitfinex Margin L/S
 ETF Tracker
 Solana ETF
 XRP ETF
 Hong Kong ETF
 Bitcoin Treasuries
 Crypto Reversal
 Ethereum Reserves
 HyperLiquid Wallet Analysis
 Hyperliquid Whale Watch
 Large Transactions
 On-chain Movement
 Bitcoin ROI
 Stablecoin Market Cap
 Options Analysis
 News
News Articles
 Economic Calendar
 Features
 Wallet
 Contract Calculator


 Security
 Collections
 Watchlist
 Following
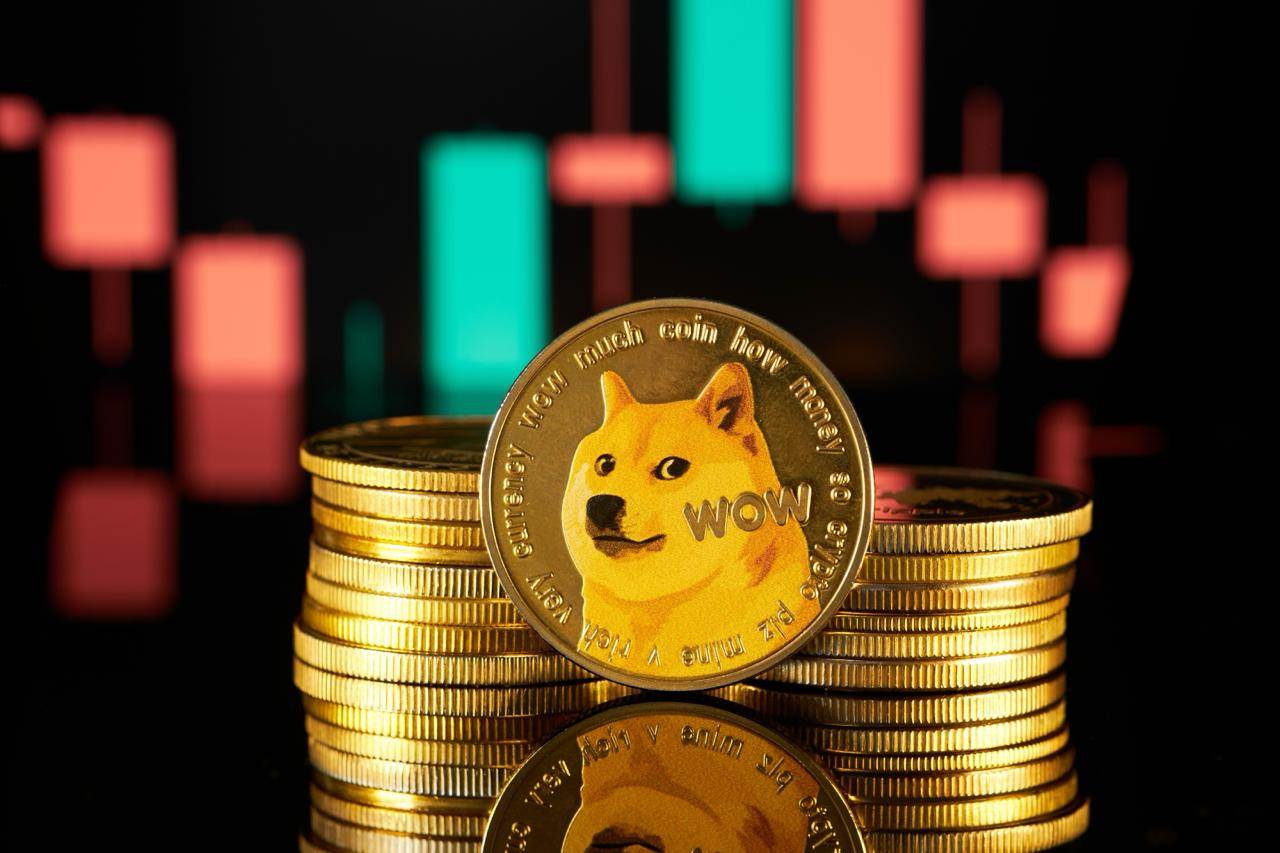
 DOGE
DOGE Key Points
DOGE stalled below the $0.1014 Fibonacci resistance level.
The 0.088-0.089 USD range combines Fibonacci support with a 200-day moving average.
Futures trading volume is almost six times that of spot trading volume.
The total position of DOGE ETF is approximately US$20.9 million.
Daily closing above US$0.1014 will open up US$0.1119 space.
DOGE has hit levels lost in previous declines
DOGE climbed to an intraday high of US$0.1007 on the Kraken daily chart, stopping just below US$0.1014 (0.382 Fibonacci pullback). The buyer has reached the threshold of this level, but has not been able to overcome it.
US$0.1014 is not the precise peak of DOGE's May rally-prices were closer to US$0.115 before falling back. However, this position was the key platform lost when the rally collapsed. Once DOGE fell below that level, the decline accelerated, eventually pushing the token to a low of $0.07. Traders who were trapped in this position at the time now have a natural selling window.
This history makes the current test more important than the regular Fibonacci test. If there is another intraday shadow line, the issue remains unresolved. DOGE needs the daily closing price to stand firm at US$0.1014 and continue to break through before the market can view this level as regaining support. The next Fibonacci sign is located near $0.1119.
Prices jump above moving average
After a sharp rebound, DOGE is currently trading above its 50-day, 100-day and 200-day simple moving averages. However, the moving average below prices is still in a downward trend: the 50-day moving average is about $0.0727, which is about $0.0817 below the 100-day moving average, and the 200-day moving average is higher, about $0.0893.
This bearish ranking does not negate a rebound, but shows how quickly prices are moving relative to broader trends. Sustainable reversals usually require time for these moving averages to flatten out and reorder; while a sharp squeeze can break through all three moving averages in one go without changing the larger structure below.
US$0.088 -0.089 is a position that buyers must hold
The first pullback has a clear target area. 0.236 The Fibonacci pullback is at $0.0884, almost coinciding with the 200-day moving average of $0.0893. If DOGE falls back to this point, it will face technical obstacles and a situation where the long-term daily moving average is compressed within the price range of less than 1 cent.
A pullback to this range will not in itself break the current structure. Markets often test the breakthrough point before deciding whether a breakthrough will be effective. The key is the quality of the market's response: buyers need to hold the area based on the daily close and push prices back above, rather than letting $0.088 -0.089 become the new resistance level.
If the closing price falls below this dense zone, the 100-day moving average of approximately US$0.0817 will come back into view. A loss to this level would put the 50-day moving average around $0.0727 and $0.067 band lows as the next support level, bringing DOGE back to the lower edge of the range it just escaped from.
Most trading takes place in the futures market[TAG
CoinGlass data shows that DOGE futures trading volume in 24 hours is about $6.09 billion, while spot trading volume is about $1.03 billion. Futures activity was almost 5.9 times the volume of the physical market. Open interest was approximately $1.57 billion, while DOGE positions of approximately $44.3 million were liquidated during the same period.
This ratio does not reveal who wins the next round, bulls or bears. But it shows where the market mainly conducts price discovery. Such a huge futures market can quickly amplify breakthroughs, but it can also turn mild rejections into sharp fluctuations when margin positions begin to be closed.
A healthier version of the callback is: When DOGE retests US$0.088 -0.089, open interest stabilizes or decreases. This would indicate that positions are being cleared while buyers absorb supply. If open interest rises rapidly below $0.1014, it presents a different picture: more leveraged funds enter and prices are struggling with established resistance above.
DOGE owns ETFs but lacks deep institutional buying
Dogecoin now has regulated investment products, but its size remains limited.
REX-Osprey's DOJE reported fund assets of US$10.84 million as of August 20.
Grayscale's GDOG showed $7.9 million, while 21Shares's TDOG held $2.2 million as of August 19.
The three together hold approximately US$20.9 million-accounting for approximately 0.13% of DOGE's nearly US$16 billion market value. Fund assets do not measure daily inflows, but they show the size of the regulated capital pool behind the asset. DOGE has an ETF shell, but does not yet have a large, sustained institutional buyer capable of absorbing breakthroughs without the help of a broader spot market.
The ETF channel provides traditional account investors with access to DOGE. However, existing funds are too small to support attempts to exceed $0.10 alone. Once a fast-money trader exits, the spot market must absorb the sell-off.
Key factor that could change the situation
Closing above $0.1014: DOGE regained platform lost during the May decline and focused on $0.1119.
Hold on to US$0.0884 -0.0893: If the closing price returns to the 200-day moving average after the backtest, it will provide structural credibility for the rebound.
Loss of US$0.0817: A break below the 100-day moving average suggests that the US$0.088 support cluster failed to attract enough demand.
Back to US$0.0727 -0.067: This trend will put DOGE back into the old range, weakening the argument for a trend shift.
DOGE is no longer at its July bottom near $0.07, with Friday's surge forcing prices to break through the average that has suppressed the market for months. The moving average has not yet shifted, fund assets are still weak, and derivatives account for most trading activity. A controlled pullback into the $0.088 -0.089 region would provide buyers with the opportunity to prove the materiality of the rebound. Failure in this region would make the rush to $0.10 the first rejection of the old range rather than the beginning of a new trend.
Method description: Fibonacci levels, moving averages, volumes and RSI data are taken from the Kraken DOGE/USD daily chart at 20:11 UTC on August 22, 2026. Derivatives and spot market data came from CoinGlass, with a review date of August 22. ETF asset data is from the issuer's page from August 19 to 20 and may change daily.
This article is for information reference only and does not constitute investment advice.