Exchange Ranking
 Top Exchanges
 24h Volume Ranking
 Popularity Ranking
 Exchange BTC Balance
 Proof of Reserves
 Decentralized Exchanges
 Funding Rate
 Funding Heatmap
 Liquidation Data
 Max Pain
 Long/Short Ratio
 Whale L/S Ratio
 Binance/Okex/Huobi L/S
 Bitfinex Margin L/S
 ETF Tracker
 Solana ETF
 XRP ETF
 Hong Kong ETF
 Bitcoin Treasuries
 Crypto Reversal
 Ethereum Reserves
 HyperLiquid Wallet Analysis
 Hyperliquid Whale Watch
 Large Transactions
 On-chain Movement
 Bitcoin ROI
 Stablecoin Market Cap
 Options Analysis
 News
News Articles
 Economic Calendar
 Features
 Wallet
 Contract Calculator


 Security
 Collections
 Watchlist
 Following
 SUI
SUI SUI's TD Sequential buy signal suggests selling pressure is weakening
Current selling pressure is weakening and the recent correction may be close to exhaustion. Prices are compressed between upward support and downward resistance, and the space is narrowing day by day. SUI is about to face a key directional breakthrough. Short-term moving averages favor buyers. If momentum continues to build, a breakthrough of $0.78 could test the resistance range of $0.80 to $0.85.
SUI's rebound has entered a decisive technical phase as selling pressure abates near key levels. The TD Sequential signal and the tightening price structure have focused the market on the next step.
TD Sequential signal indicates possible selling failure
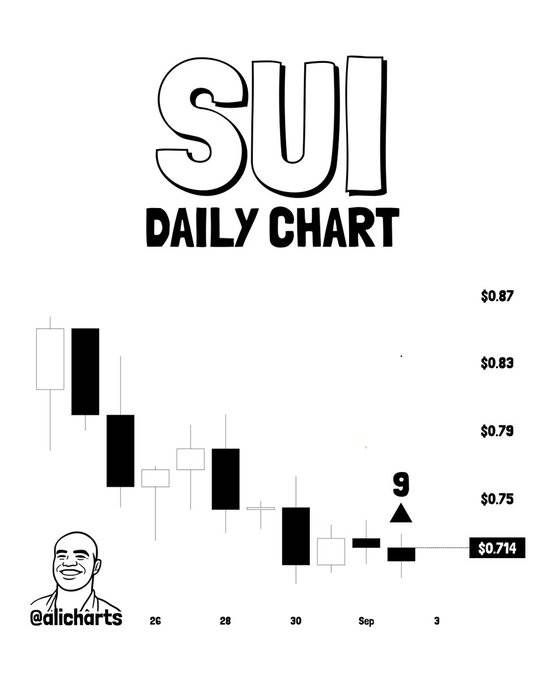
Ali Charts recently identified a TD Sequential buy signal on SUI's daily chart. The indicator came after a correction extending towards the $0.714 area, suggesting that the recent selling sequence may be drawing to an end.
 Source:X
TD Sequential formed a signal reading of "9" near the latest low. Such readings typically signal a rally that lasts one to four trading days and may mark the beginning of a new round of bullish countdown.
Prior to the signal, SUI fell from approximately US$0.83 to US$0.84. Several bearish K lines penetrated the middle price, and then momentum began to slow down. Near the US$0.71 to US$0.73 region, K-line entities are getting smaller.
This change in the K-line pattern reflects the weakening of directional momentum near recent lows. However, this indicator alone cannot confirm a complete reversal of the trend. Before the short structure is broken, prices still need subsequent movements to confirm validity.
Triangle compression puts breakthrough levels in focus
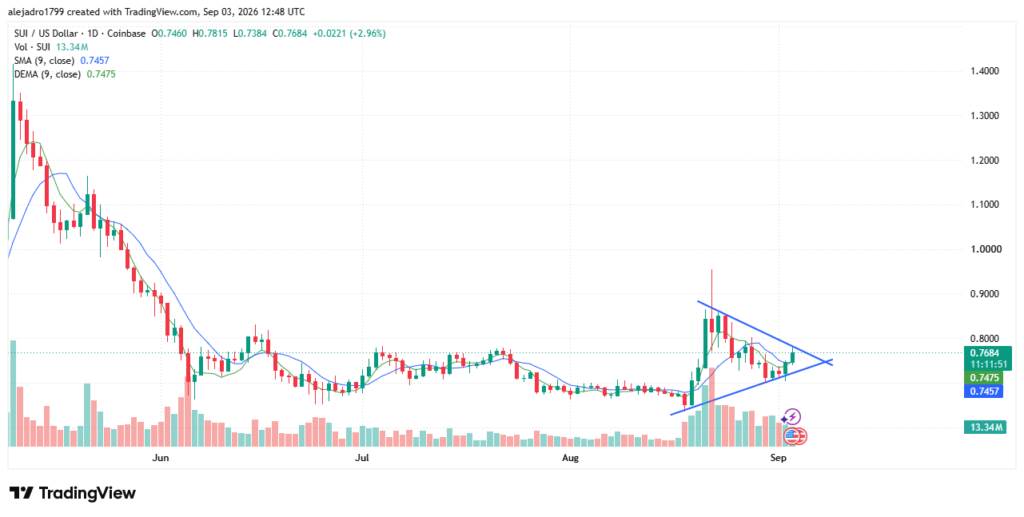
The daily chart shows that SUI is currently converging between two trend lines. Downward resistance from the recent $0.85 to $0.90 area is still limiting price gains. At the same time, rising support reflects buyers defending gradually higher lows.
 Source:Tradingview
This narrowed pattern puts the market at an important technical decision point. Volatility has shrunk as the distance between the two trend lines continues to shrink. Therefore, breakthroughs may trigger stronger directional movements.
As of writing, SUI was trading at approximately US$0.7668, a daily increase of approximately 2.57%. Prices are pushing up the top of the rising triangle.
Prices hit the top of the rising triangle. The first sign of a breakthrough appeared around $0.77 to $0.78.
If the daily chart produces a convincing daily close above the downward resistance level, this adjustment pattern will be tested. Increased volume during this process will provide additional confirmation of market participation. Without confirmation, refusing to increase may cause prices to fall back to nearby support levels.
Moving Average and Volume Definition Next Test
As of the time of writing, the short-term moving average is below the latest market price. The 9-day simple moving average (SMA) shown on the chart is around $0.7455. The 9-day exponential moving average (EMA) is slightly higher, at around $0.7469.
Trading above these two moving averages gives buyers a slight short-term advantage. However, the broader price structure remains fragile until resistance above is recovered. 0.80 The to $0.85 area represents the next important supply area.
During the rebound from lows in late August, trading volume expanded sharply. As SUI enters the current integration phase, activity is gradually decreasing. This model is in line with the compression characteristics of the market before a potential breakthrough.
If attempts to break through resistance fail, SUI may fall to support between US$0.745 and US$0.73. Losing the area would expose recent lows near $0.70 again. Currently, SUI's rebound depends on the confirmation of the decisive K-line next.