Exchange Ranking
 Top Exchanges
 24h Volume Ranking
 Popularity Ranking
 Exchange BTC Balance
 Proof of Reserves
 Decentralized Exchanges
 Funding Rate
 Funding Heatmap
 Liquidation Data
 Max Pain
 Long/Short Ratio
 Whale L/S Ratio
 Binance/Okex/Huobi L/S
 Bitfinex Margin L/S
 ETF Tracker
 Solana ETF
 XRP ETF
 Hong Kong ETF
 Bitcoin Treasuries
 Crypto Reversal
 Ethereum Reserves
 HyperLiquid Wallet Analysis
 Hyperliquid Whale Watch
 Large Transactions
 On-chain Movement
 Bitcoin ROI
 Stablecoin Market Cap
 Options Analysis
 News
News Articles
 Economic Calendar
 Features
 Wallet
 Contract Calculator


 Security
 Collections
 Watchlist
 Following
 BTC
BTC Key insights
Bitcoin dollar prices are close to US$62,000 support due to increased selling pressure.
A break below US$60,000 may put Bitcoin at a level below US$57,000.
Whale accumulation conflicts with increased exchange inflows and weak spot demand.
On Friday, August 14, the bitcoin dollar price fell near the lower edge of its August range. Bitcoin traded around $62,831 after hitting an intraday low of around $62,648. As exchange inflows increased, market attention returned to support.
This decline is important because Bitcoin is still trapped in a wide range rather than confirming a directional breakthrough. Multiple market indicators show conflicting signals between exchange activity and large wallet accumulation. The divergence has caused traders to focus on the $62,000 area and the broader $60,000 floor.
Bitcoin dollar price slides towards US$62,000 support
Market data showed that Bitcoin fluctuated roughly between US$62,648 and US$63,918 during Friday's trading session. Binance separately recorded BTC/USDT close to $63,553, with a 24-hour low of $62,802. Its spot market processed approximately 10,797 BTC during this period. 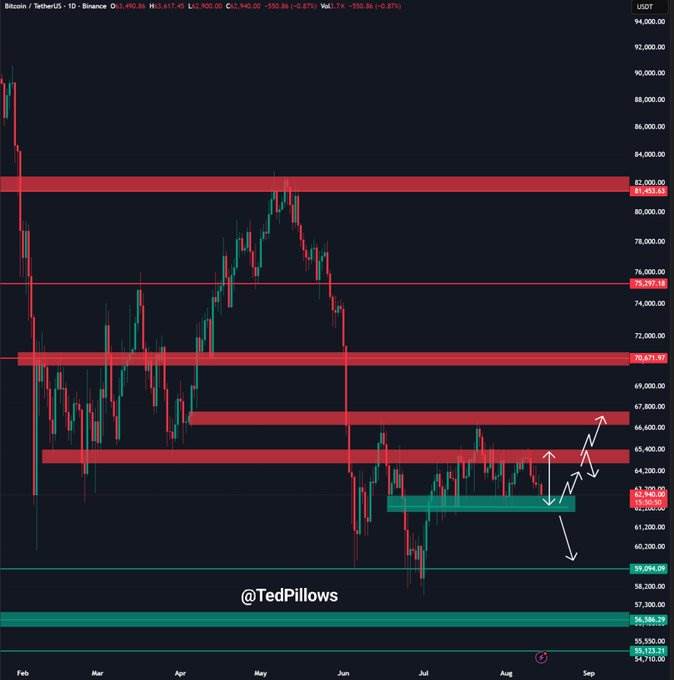 Source: XTed, a cryptocurrency trader posted under the name of TedPillows, stated that Bitcoin is close to the US$62,000 -62,500 support area. He said if the area fell, the $60,000 level could be exposed. His assessment came after Bitcoin repeatedly tested the lower edge of its August trading range.
As a result, today's Bitcoin price remains sensitive to a narrow technical range. Buyers must hold on to the lower edge of the range before they can try to rebound towards nearby resistance levels. Continued breaks below support will weaken the short-term structure.
The Bitcoin dollar price structure still retains a risk of US$57,000
Kaz, who posted under the name of XBTkaz, identified US$62,800 as an order block area that initially attracted buyers. He also pointed out that there are unsmoothed low levels around $62,200. Kaz expects a possible rebound to $64,500 -65,000 before testing the downside again. 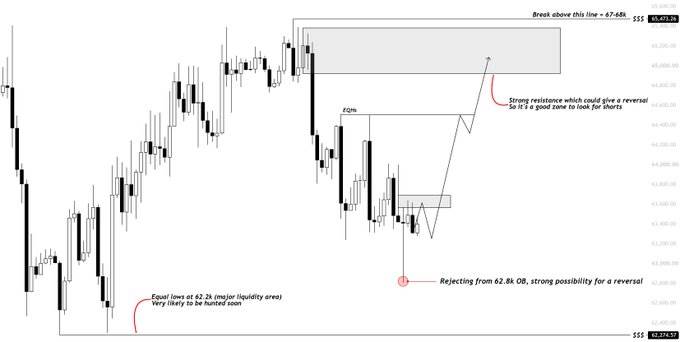 Bitcoin price chart. Source: X
He said that if it continues to rise above US$65,400, the US$67,000 -68,000 area may be exposed. This level represents the next major upside area in its short-term framework. If the area is not recovered, lower liquidity levels will be exposed.
KillaXBT identified August 14 as a potential turning window earlier this month. He said that out of ten observed cases, Bitcoin had eight historical negative reactions around this date. However, this pattern only represents his historical research, rather than a deterministic signal.
On Friday, Killa said Bitcoin entered the date on a decline. He believes that the maintenance range needs to turn around the current level. Conversely, a break below $60,000 could expose August prices below $57,000.
This downside scenario is still conditional rather than confirmatory. Bitcoin remains above the $60,000 threshold during trading hours. The market also retained support from nearby whale accumulations previously identified by CryptoQuant.
Bitcoin dollar prices face conflicting whale signals
CryptoQuant contributor Woominkyu reported a reversal in whale supply on June 14. Wallets holding at least 100 BTC turned back to accumulation around this period. CryptoQuant linked the reversal to a rebound to $65,705. 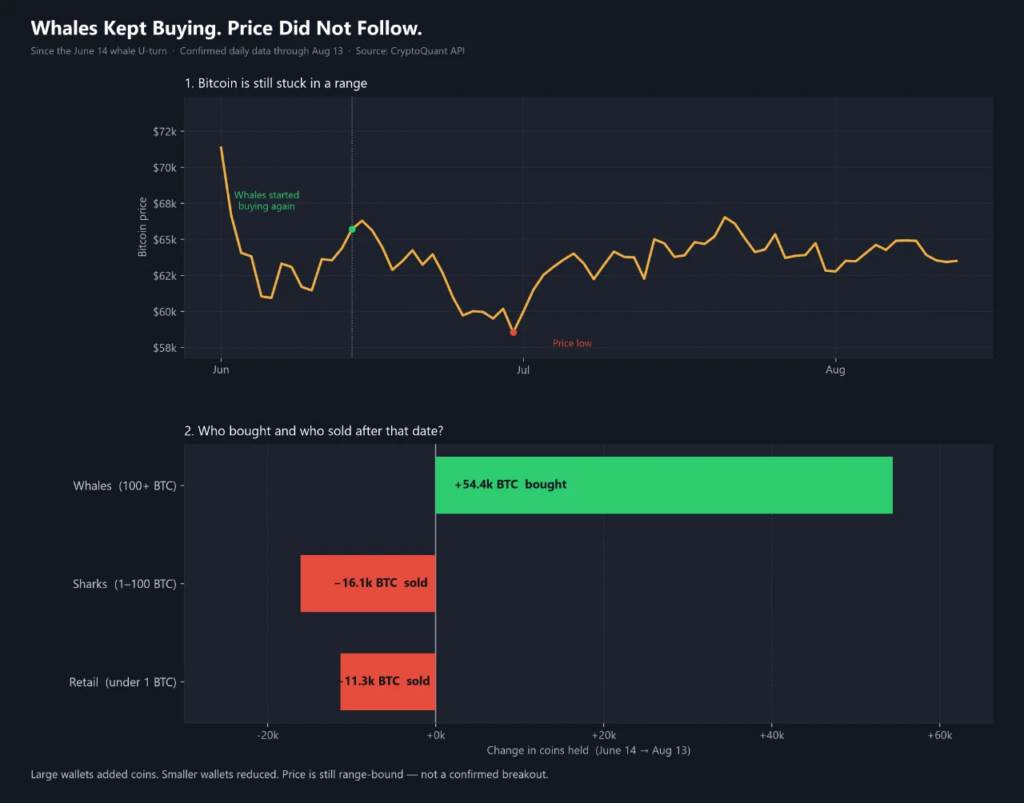 Source: CryptoQuant
Another analysis by CryptoQuant surrounding the June sell-off showed stronger whale activity below $60,000. The agency reported an exchange whale ratio of 61.6% near the $60,000 -61,000 area. Then during the recovery, more than 11,000 BTC left the exchange.
Current exchange traffic shows different short-term stress signals. CryptoPatel said wallets holding 1,000-10,000 BTC increased Binance inflows, which were 793% higher than its 90-day baseline.
CryptoPatel also mentioned continued Coinbase outflows and increased supply of Binance, Upbit and Bybit. He said the Coinbase premium remained negative, while funding rates remained relatively stable. These conditions suggest weak U.S. spot demand despite large holder activity.
This divergence complicates the prospects for Bitcoin's cryptocurrency. Whale accumulation can reduce available supply over a longer period of time. However, an increase in exchange deposits could immediately increase the supply of tradable and potential selling pressure.
Next support and resistance
Binance market data shows that Bitcoin is still below US$64,000 during the latest trading session. The exchange lists a 24-hour range of approximately $62,802 to $64,010. This puts prices below the resistance zone identified by Kaz.
Today's Bitcoin price remains focused on the US$62,000 -62,500 support area. If a loss is confirmed, attention will turn to $60,000, an area where whale buying occurred in June. Killa's downside scenario points below $57,000 only if the broader bottom is broken.
On the upside side, Kaz's US$64,500 -65,000 area remains the first resistance area. A breakthrough of $65,400 would weaken the immediate bearish pattern. Prior to this, the bitcoin dollar price structure was still in range fluctuations, and downward pressure was concentrated near the support level.