Exchange Ranking
 Top Exchanges
 24h Volume Ranking
 Popularity Ranking
 Exchange BTC Balance
 Proof of Reserves
 Decentralized Exchanges
 Funding Rate
 Funding Heatmap
 Liquidation Data
 Max Pain
 Long/Short Ratio
 Whale L/S Ratio
 Binance/Okex/Huobi L/S
 Bitfinex Margin L/S
 ETF Tracker
 Solana ETF
 XRP ETF
 Hong Kong ETF
 Bitcoin Treasuries
 Crypto Reversal
 Ethereum Reserves
 HyperLiquid Wallet Analysis
 Hyperliquid Whale Watch
 Large Transactions
 On-chain Movement
 Bitcoin ROI
 Stablecoin Market Cap
 Options Analysis
 News
 Articles
 Economic Calendar
 Features
 Wallet
 Contract Calculator


 Security
 Collections
 Watchlist
 Following
 BTC
比特币价格回落至8.3万美元附近,关键技术指标与资金流向分析
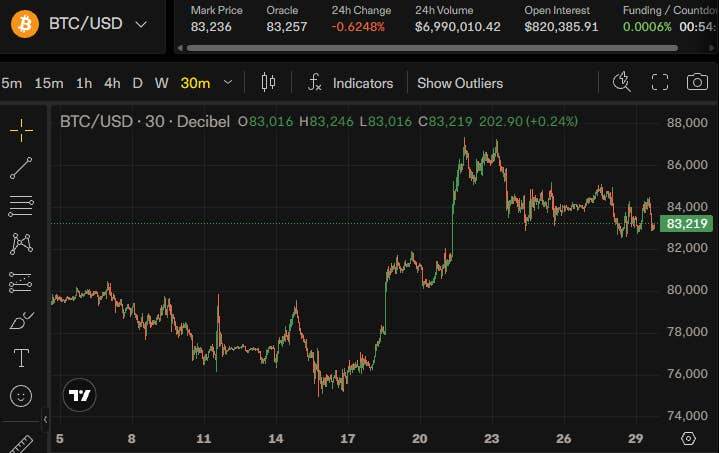
9月29日,比特币价格在触及上周近87,400美元的高点后出现回调,价格向83,000美元下方滑落。最新的4小时级别下跌使价格接近一个关键支撑区域,该区域同时也聚集了大量的潜在多头清算订单。
市场概况与技术面分析
在9月21日触及约87,400美元的峰值后,比特币的交易价格维持在83,000美元附近。从技术指标来看,4小时平均方向性指数(ADX)已降至12.39,表明近期的趋势动能正在减弱。根据CoinGlass的数据显示,在82,300–82,600美元区间以及85,500美元附近存在密集的清算带。
在9月21日至25日的交易周内,美国现货比特币ETF吸引了23.9亿美元的资金流入。截至9月29日晚间,TradingView上的Binance BTC/USDT图表显示,比特币价格约为83,050美元,较9月21日的高点有所回落。尽管日线价格已跌破84,000美元关口,但仍运行于20日简单移动平均线(当前为80,944美元)之上。这一走势使得比特币处于近期高点与82,600–83,000美元附近的密集支撑区之间。
此次回调的背景与美国国债收益率上升及油价波动等宏观因素有关。虽然这些因素构成了价格变动的宏观背景,但仅凭价格图表无法确切判断跌幅中有多少来自获利了结、利率预期变化或其他卖压。
4小时图关键点位:82,665美元成为焦点
在TradingView图表上,比特币最新的4小时K线从开盘价约84,358美元跌至约83,032美元,最低触及82,910美元,使价格逼近下轨布林带(82,665美元)。中轨位于83,932美元,而上轨则在85,198美元附近。
若能回升突破中轨,84,000美元将重新成为关注重点,随后才是测试85,000–85,200美元区域的机会。而此前近87,400美元的高点仍构成进一步反弹的阻力。在过去几个交易日中,比特币试图反弹的努力均在该高点下方受阻。
4小时ADX指标读数仅为12.39。ADX衡量的是趋势强度而非方向,低读数表明在此时间框架内,此前的上涨动能已经丧失。自从周高点首次下跌以来,价格一直在布林带中轨附近震荡,直至最近才向下轨移动。
日线图结构依然稳健
从日线图来看,更广泛的移动平均线结构仍位于长期均线之上。比特币交易价格高于20日均线(80,944美元)、50日均线(76,883美元)、100日均线(70,135美元)以及200日均线(约71,235美元)。
The daily Chaikin Money Flow reading was slightly positive at 0.04. This is closer to zero than the early reading of the rally in mid-September, indicating that although the indicator remains positive, daily buying pressure is weakening.
Two-way clearing band reveals long-short game
CoinGlass's week-long Bitcoin clearing heat chart shows that the most significant near-end clearing band lies in the US$82,300 - 82,600 range. Bitcoin touched this area multiple times during its decline on September 28 and 29. If prices continue to fall below this range, the market's attention will shift to the lower liquidity area around $81,000 and the daily 20-day moving average ($80,944).
Above the market, the heat map shows a significant clearing band in the US$85,400 - 85,700 range, and also a concentrated distribution around US$87,300 and US$88,000. These areas mark estimated clearing exposures rather than confirmed future price targets. If the price exceeds US$85,500, a higher concentration clearing area will be activated; if it encounters another rejection, Bitcoin will continue to trade below the liquidity created by previous gains.
Thechart also explains why the $82,000 - 85,500 range is crucial in the short term. Since its sharp fall from its high on September 21, Bitcoin has repeatedly fluctuated between its low support area and a rebound of more than $84,000. The latest decline has brought prices back to the lower edge of the range.
ETF capital inflows contrast with late correction
根据Farside Investors的数据,美国现货比特币ETF在9月21日至25日的交易周内实现了23.9亿美元的净流入,且连续五个交易日均为正流入。其中周一就贡献了约9.99亿美元。这些资金流入发生在一周内比特币先创下八个月新高随后部分回撤的背景下。ETF申购显示了在此期间通过美国基金持续存在的市场需求,但这并不能指明是谁在随后的下跌中抛售了比特币,也无法证实基金是否在9月29日进行了抄底操作。
长期持有者数据呈现“健康重置”
加密市场评论员Gerla在9月29日发布的一篇帖子中指出,经过调整的长期持有者市值与实现价值比率(MVRV)已回升至约1.35,此前该指标曾短暂跌破盈利水平。Gerla将此变化描述为一种“健康的重置”,但这一定性取决于当前支撑位是否能够守住。
对于短期图表而言,82,600美元是首要观察水平。守住该位置将为再次测试83,932美元以及85,500美元附近的清算带留下空间。若价格持续跌破该位置,则将暴露80,900–81,000美元区域,届时美国ETF资金流和国债收益率将为下一步走势提供进一步的背景参考。