Exchange Ranking
 Top Exchanges
 24h Volume Ranking
 Popularity Ranking
 Exchange BTC Balance
 Proof of Reserves
 Decentralized Exchanges
 Funding Rate
 Funding Heatmap
 Liquidation Data
 Max Pain
 Long/Short Ratio
 Whale L/S Ratio
 Binance/Okex/Huobi L/S
 Bitfinex Margin L/S
 ETF Tracker
 Solana ETF
 XRP ETF
 Hong Kong ETF
 Bitcoin Treasuries
 Crypto Reversal
 Ethereum Reserves
 HyperLiquid Wallet Analysis
 Hyperliquid Whale Watch
 Large Transactions
 On-chain Movement
 Bitcoin ROI
 Stablecoin Market Cap
 Options Analysis
 News
News Articles
 Economic Calendar
 Features
 Wallet
 Contract Calculator


 Security
 Collections
 Watchlist
 Following
 BTC
BTC  ETH
ETH Ethereum (ETH) Trend Analysis
Ethereum (ETH) is currently trading at around US$2400. Selling pressure is accelerating downward.
As the largest altcoin, Ethereum's market structure has been strengthened after buyers successfully held on to the long-term upward trend line. This rebound triggered by macro support prompted ETH to break through the initial resistance zone and transform previous ceilings into near-term support.
The current trading price of Ethereum is US$2,404, and the 24-hour trading volume reaches US$13.23 billion. Over the past day, the price range ranged from $2,357 to $2,417, while the seven-day range ranged from $2,357 to $2,558. The recovery has maintained broader bullish momentum; the latest price movements suggest that markets may cool after aggressive gains.
Support and Resistance Levels for Ethereum
The current core issue is whether the newly recovered support level can be held when assets approach the next supply area. The possibility of a short-term pullback towards $2,300 -2,200 remains, with the 0.236 Fibonacci retracement level of $2,324 providing a potential early support area.
From the perspective of Elliot Wave Theory, ETH appears to be completing a daily-level third wave, followed by a possible fourth wave correction, with a target range of $2,112 to $2,222. Since the previous second wave correction was particularly severe, the current correction may be relatively shallow. If the daily line closes below $2,050, the structure of this fourth wave will be destroyed.
On the other hand, a rally starting at $2,324 could push Ethereum to the target area of $2,784 -2,966 before a deeper correction could occur. In addition, the broader bullish target remains around $3,000.
Currently, price movements reflect that the market is moving from a recovery phase to an expansion phase. Absorbing selling pressure from above while holding on to recovered support will strengthen bullish views; losing key support could delay the next major rally.
Will ETH kinetic energy weaken further?
The MACD indicator line is below the signal line, and both lines are below the zero axis. This crossover suggests strong bearish momentum in both the short and long time frames. It is worth noting that the overall market trend of Ethereum is strictly short.
In addition, selling pressure is accelerating downward. This is one of the strongest sell signals in technical analysis, indicating that bears are dominant and prices are likely to continue to fall.
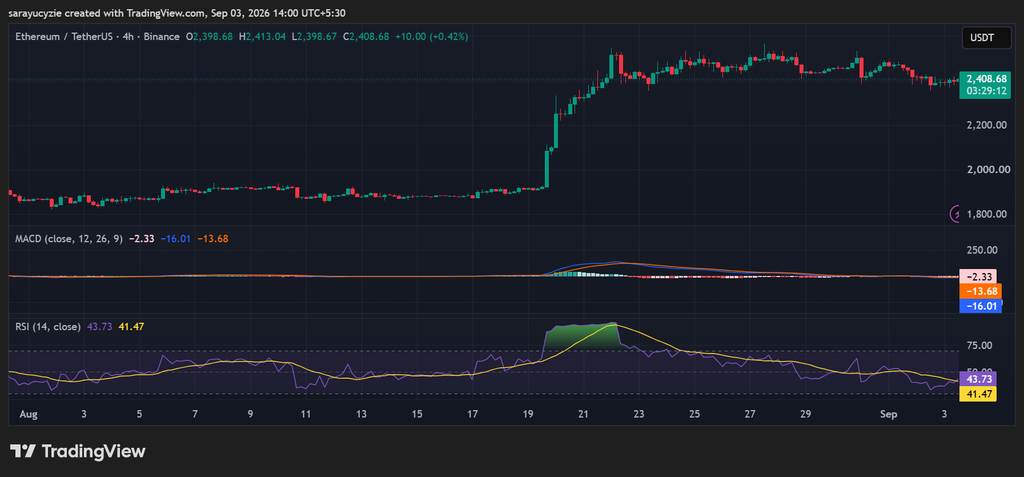 (Source:TradingView)
In addition, Ethereum's daily RSI is at 43.73, indicating neutral weak momentum. Trading below the 50 mark suggests that recent price declines on the K-line have slightly exceeded increases.
There is still room for downside before prices become oversold. Traders focus on breaking 50 to confirm new bullish momentum, or breaking 40 to signal accelerating selling pressure.