Exchange Ranking
 Top Exchanges
 24h Volume Ranking
 Popularity Ranking
 Exchange BTC Balance
 Proof of Reserves
 Decentralized Exchanges
 Funding Rate
 Funding Heatmap
 Liquidation Data
 Max Pain
 Long/Short Ratio
 Whale L/S Ratio
 Binance/Okex/Huobi L/S
 Bitfinex Margin L/S
 ETF Tracker
 Solana ETF
 XRP ETF
 Hong Kong ETF
 Bitcoin Treasuries
 Crypto Reversal
 Ethereum Reserves
 HyperLiquid Wallet Analysis
 Hyperliquid Whale Watch
 Large Transactions
 On-chain Movement
 Bitcoin ROI
 Stablecoin Market Cap
 Options Analysis
 News
News Articles
 Economic Calendar
 Features
 Wallet
 Contract Calculator


 Security
 Collections
 Watchlist
 Following
 ADA
ADA Cardano prices return to familiar technical patterns, ADA shows buy signals
After another correction in the broader structure, Cardano (ADA) prices have returned to a familiar technical pattern. ADA is currently trading at around $0.20 and a new Tom DeMark Sequential buy signal appears on the daily chart. The signal is important because similar readings have appeared near Cardano bottoms in several recent times, all of which have subsequently triggered large rallies. If the ADA continues to form higher highs and higher lows, the current price structure also supports the possibility of further gains.
Looking at Cardano's price chart, we can see that since the end of July, the market has shown a clear structure of "higher highs" and "higher lows". The ADA first reached a low at around $0.138 and then climbed to around $0.199. The price then fell back to about $0.153, but remained above the previous bottom. Another round of gains followed pushed Cardano higher to $0.21, before the ADA fell back to around $0.170, which once again formed a higher low. Since then, Cardano has continued to climb to $0.258, becoming the latest major high. Since then, the ADA has fallen back to about $0.189, and then returned to its current range of about $0.20.
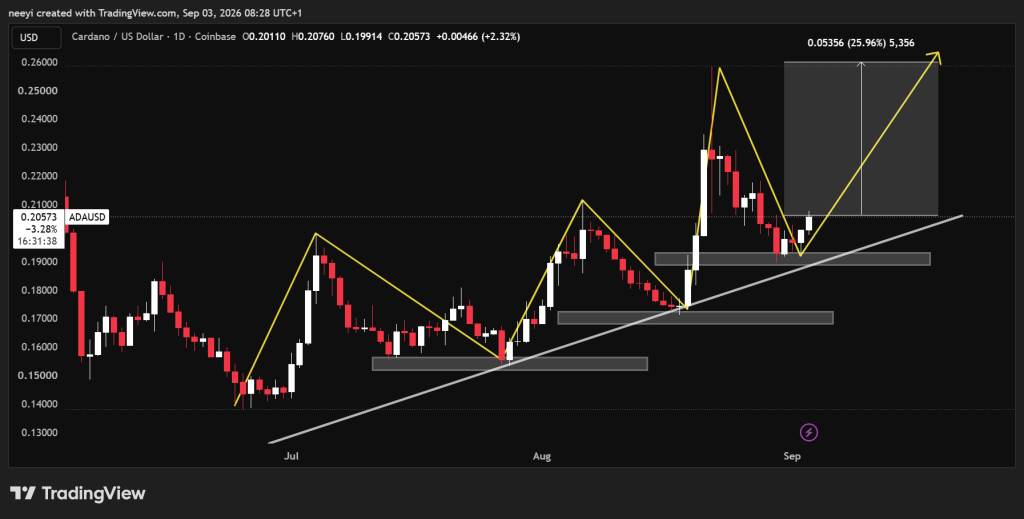
ADA price chart shows lower lows and higher highs/ TradingView.com
This sequence can be summarized as follows:
- ADA hit bottom at about $0.138 before hitting $0.199.
- The next low formed at around $0.153 before the price climbed to $0.21.
- Before the ADA reached $0.258, another higher low appeared at about $0.170.
- The recent major bottom formed at approximately US$0.189.
This structure remains technically constructive as long as the sequence of higher lows remains intact.
ADA may retest $0.258 if current patterns persist
The next main question is where Cardano's price might move if the existing structure persists. The ADA has recovered from about $0.189 to about $0.20. To continue the pattern of higher highs, prices will eventually need to break past previous highs of close to $0.258. Such a move would mean a gain of about 40% from the recent bottom of $0.189. If the ADA returns above $0.258, judging from the current price of about $0.20, the upside will still exceed 25%.
Therefore, if the buyer retains control, the technical side is conducive to continuing to extend into the area. The strongest entry point based purely on this model should appear near the recent bottom a few days ago. As the ADA has moved away from that level, potential percentage returns from current prices have decreased.
If the trend continues in the next few days or weeks, Cardano still has room for upside. A breakthrough of $0.258 would confirm another higher high and strengthen existing market structures.
Tom DeMark Sequential buy signal marked the recent Cardano bottom
Ali Charts pointed out that the Tom DeMark Sequential indicator sends another buy signal on Cardano's daily chart. Recent examples show that the market has rebounded significantly after the indicator emerged.
The June 25 signal appeared before the 44.5% gain; the July 15 signal appeared before the 11.5% gain; and the August 18 signal appeared before the 50.9% gain. These historical readings do not guarantee similar movements, but they suggest that the indicator has successfully identified several important Cardano price bottoms in recent market cycles.
When the new signal is combined with the ADA's higher highs and higher lows structure, its significance becomes even more significant. Cardano's recent low is around $0.189, still above the previous major low of $0.170. Unless the ADA loses the trend support that guides near-term recovery, the bullish structure remains intact.
Cardano's daily indicators are mostly biased towards buyers
Cardano's daily indicators are currently biased towards positive, although one of the momentum readings is still weak.
- RSI (Relative Strength Index): has a value of 55.086, putting Cardano above the neutral level of 50. Buyers have a moderate advantage, but have not pushed ADA into overbought status.
- MACD (Smoothing Similarities and Differences Moving Average): value is 0.003 and remains positive. This reading supports the current recovery and suggests that medium-term momentum is now favoring buyers.
- Ultimate Oscillator: The reading was 47.162. The indicator is still below the neutral zone and is the weakest signal of the four readings.
- Bull Bear Power: The value is 0.0048 and remains positive. Based on this measure of long-short pressure, buyers retain an advantage.
Overall, the indicator picture is biased towards a bullish one. RSI, MACD and Bull Bear Power supported buyers, while Ultimate Oscillator remained the main weak reading.
Cardano's moving average shows a mixed medium-to long-term picture
Cardano's moving average provides another useful perspective on the current pattern.
- 50-day simple moving average (MA50): is approximately US$0.1869. ADA currently trades above this level, giving positive technical readings for short-term trends.
- 200-day simple moving average (MA200): is still well above US$0.2198. Cardano is still trading below this level, which means the broader trend has not yet fully turned bullish.
The difference between the two moving averages explains why Cardano's form is constructive but not fully bullish. ADA trading on top of the MA50 supports the current recovery. Breaking through the nearly $0.2198 MA200 would provide stronger technical confirmation and increase the possibility of testing $0.258 again.
Cardano prices are still likely to rise by more than 25% from current levels
Cardano's latest price structure makes $0.258 the most important target for higher highs. If prices end up slightly above previous highs, ADA will rise by about 40% from its recent bottom of about $0.189. As a result, buyers entering near the recent bottom will gain greater upside exposure from this level.
If Cardano returns to US$0.258 or exceeds that level, the potential increase will still exceed 25% based on the current price of around US$0.20. Much depends on whether the pattern of higher highs and higher lows remains intact. The current Tom DeMark Sequential buy signal, positive RSI, positive MACD, positive Bull Bear Power and prices above the MA50 all support bullish views.
The nearly $0.2198 MA200 remains a significant obstacle before Cardano challenges its previous high of $0.258. The ADA's reaction near that moving average may be the clearest indicator of whether this latest buying signal will turn into another major rally.
FAQs
Does ADA have a future?
Yes, Cardano (ADA) is backed by a dedicated development community and continuous protocol upgrades, but its long-term success remains uncertain due to slow user adoption and low liquidity compared to rival blockchains.
Will Cardano ADA reach $10?
Mainstream analytical models believe that it is unlikely that Cardano (ADA) will reach US$10 in the short term, although some cryptocurrency analysts believe this exists as a long-term possibility in major bull cycles.