Exchange Ranking
 Top Exchanges
 24h Volume Ranking
 Popularity Ranking
 Exchange BTC Balance
 Proof of Reserves
 Decentralized Exchanges
 Funding Rate
 Funding Heatmap
 Liquidation Data
 Max Pain
 Long/Short Ratio
 Whale L/S Ratio
 Binance/Okex/Huobi L/S
 Bitfinex Margin L/S
 ETF Tracker
 Solana ETF
 XRP ETF
 Hong Kong ETF
 Bitcoin Treasuries
 Crypto Reversal
 Ethereum Reserves
 HyperLiquid Wallet Analysis
 Hyperliquid Whale Watch
 Large Transactions
 On-chain Movement
 Bitcoin ROI
 Stablecoin Market Cap
 Options Analysis
 News
News Articles
 Economic Calendar
 Features
 Wallet
 Contract Calculator


 Security
 Collections
 Watchlist
 Following
 BTC
BTC 比特币价格回升,但能否守住?深度解析未来走势
比特币价格目前上涨 1.15%,交易价格为 85,987.80 美元。然而,更大的问题是:这次复苏能否持续?还是说比特币最终会跌回至 60,000 美元附近?
9 月 22 日,BTC 价格短暂突破 87,300 美元,从近期接近 75,500 美元的低位反弹约 15%。此次反弹得益于 ETF 买盘的回归、空头头寸的清算以及更广泛宏观环境的改善。然而,前方的道路并非坦途。
比特币的 200 周移动均线及其他主要支撑位已攀升至 65,000 美元以上,为市场提供了比此前更高的底部支撑。尽管如此,通胀、国债收益率、ETF 资金流向以及杠杆率等因素,将决定 60,000 美元是成为一个遥远的下行目标,还是重新成为关键的相关价位。
鉴于上述所有因素都在发挥作用,我们询问了 Claude AI:在经历惊人反弹后,BTC 是否会崩盘回测 60,000 美元?以及比特币价格在 2026 年剩余时间里可能如何表现?
我们要问 Claude AI 关于比特币下一步大动作的问题
比特币价格刚刚实现了强劲复苏,在大约一周内从 75,500 美元左右攀升至 87,300 美元以上,随后回落至 85,987.80 美元,这让投资者质疑这一涨势能否延续,或者比特币价格最终是否会重新触及 60,000 美元。
此次复苏得到了多重因素的支撑,包括 9 月 21 日美国现货比特币 ETF 流入近 10 亿美元,24 小时内超过 4.2 亿美元的比特币空头被清算,以及宏观条件改善——原油价格跌至每桶 100 美元以下,且国债收益率趋于缓和。
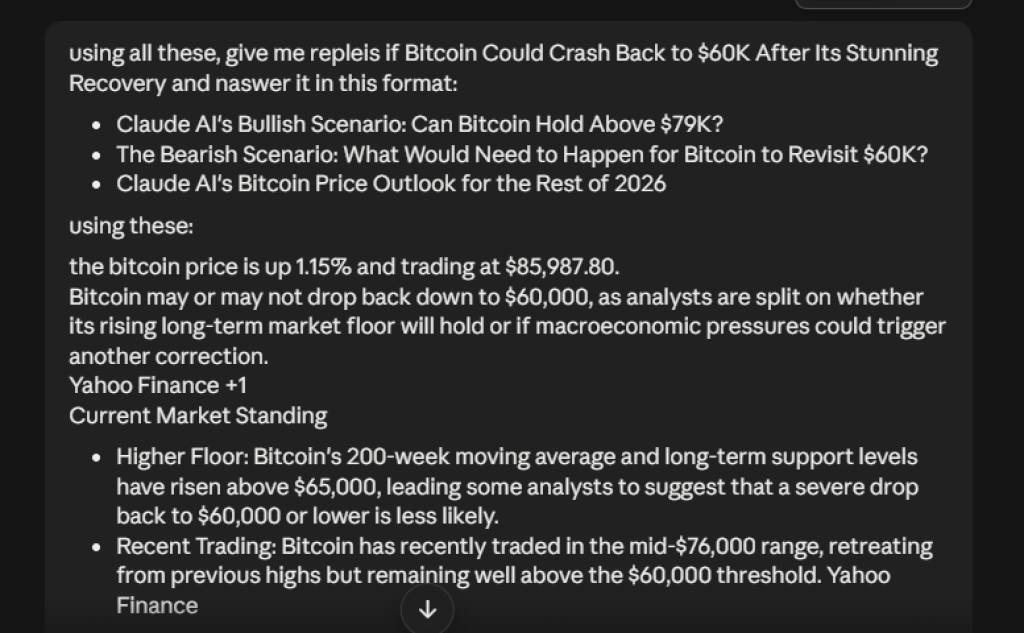
我们将这些市场数据以及围绕 60,000 美元问题的双方主要论点提供给了 Claude AI。一方面,比特币的 200 周移动均线及其他主要支撑位已升至 65,000 美元以上,形成了更高的市场底部;比特币价格收复了其 50 周移动均线,并打破了此前的更低高点结构。
另一方面, renewed 通胀压力、更高的国债收益率、较弱的 ETF 资金流、过度的杠杆或更高低点结构的破裂,都可能使 BTC 面临更深的下行风险。
随后,我们要求 Claude AI 评估三种具体可能性:比特币能否站稳 79,000 美元上方并继续向 93,000–100,000 美元区间迈进?比特币价格需要发生什么才会回落至 60,000 美元附近?以及 BTC 在 2026 年剩余时间内的交易区间可能在哪里?
分析还考虑了 ETF 需求、空头清算、未平仓合约量(Open Interest)、资金费率以及在技术层面确认或削弱复苏的关键水平。在此背景下,以下是 Claude AI 对比特币看涨案例、看跌场景以及通过 2026 年剩余时间的潜在价格路径的分析。
Claude AI 的看涨情景:比特币能站稳 79,000 美元吗?
看涨案例始于比特币更高的市场底部。200 周移动均线及其他长期支撑位已移至 65,000 美元以上,这意味着比特币价格必须突破几个既定的支撑区域才能到达 60,000 美元。
最新的反弹也将 BTC 推过 82,000 美元并向 87,300 美元靠拢,使得 82,000–83,000 美元区域成为买方需要防守的重要地带。
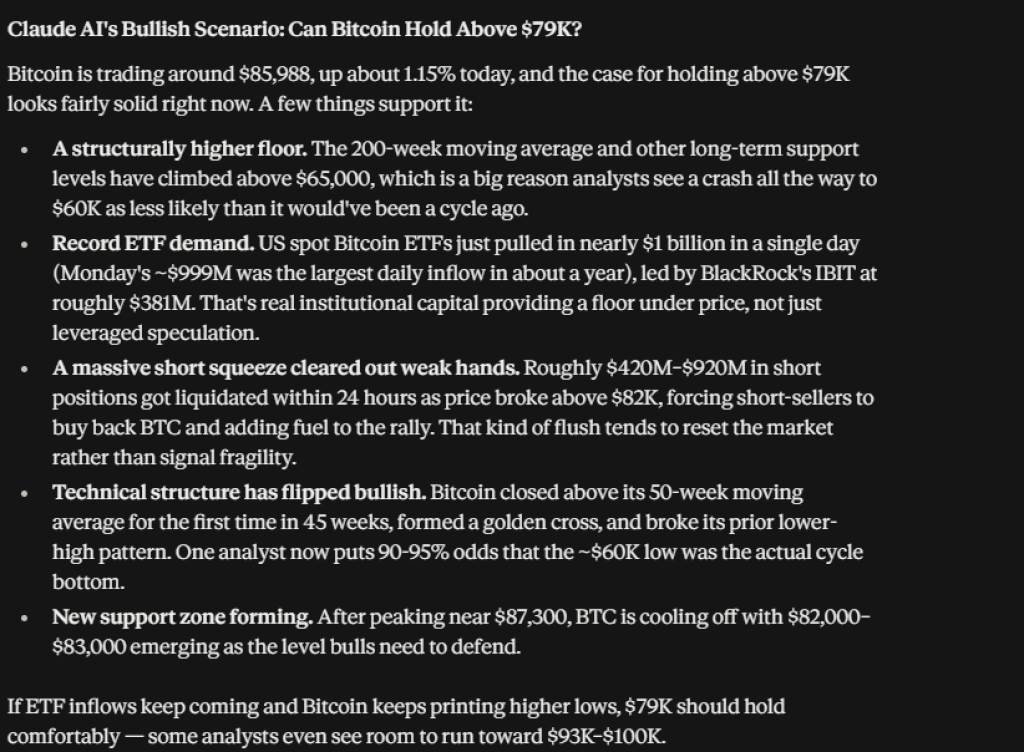
ETF 需求构成了另一个主要因素。9 月 21 日,美国现货比特币 ETF 录得 9.9895 亿美元的净流入,这是约 12 个月以来的最大单日流入。其中,贝莱德的 IBIT 占了 3.814 亿美元。如果这些流入持续下去,它们将为比特币价格下方提供持续的现货需求,而不是让复苏仅依赖于衍生品市场。
The rally was also greatly boosted by the liquidation of short positions. According to reports, more than $420 million of short Bitcoin positions were erased within 24 hours. CoinGlass data showed that BTC short liquidations were $168.56 million, while long liquidations were $37.03 million. Bitcoin also regained its 50-week moving average, breaking its previous lower-high structure and forming a golden cross.
This leaves US$79,000 well below the latest market price. If Bitcoin prices continue to form higher lows and hold on to the support area of $82,000 - 83,000, a bullish scenario points to the next target area of $93,000 - 100,000. Analyst Kevin Capital also gave a 90%-95% probability that a low of about $60,000 would be the bottom of the cycle, but this was just his assessment, not a guarantee.
Bear scenario: What conditions will it take for Bitcoin to re-test US$60,000?
For Bitcoin prices to fall near US$60,000, the current support structure needs to deteriorate significantly. A major trigger is the continued reversal of ETF funds flows. The latest inflow of $998.95 million provides strong evidence of institutional buying, but a sustained net outflow will remove some of the demand that supports the recovery.
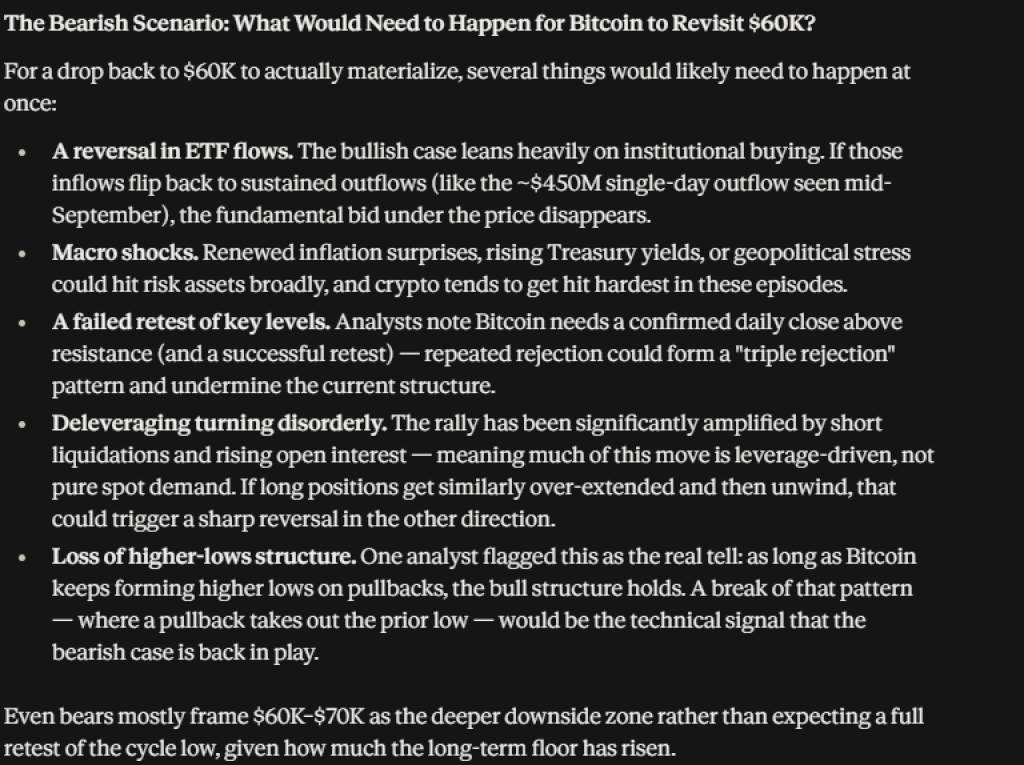
Macroeconomic conditions may cause pressures on the other hand. Inflation concerns, higher Treasury yields or new geopolitical tensions could drag on risky assets, including Bitcoin. The recent recovery has benefited from crude oil prices falling below $100 a barrel and a softening of long-term U.S. Treasury yields, so a reversal of these conditions could change market conditions.
Leverage is another risk. The rise to $86,000 was mainly driven by short clearing, with futures open interest volumes and funding rates also increasing. If traders go too far in leverage, another wave of liquidations could accelerate the decline. The key technology warning sign will be the loss of higher-low-point structures. A break below important support levels could open the door to the $70,000 area and could even point to $60,000 under a combination of more severe macro and market pressures.
Claude AI's outlook for Bitcoin prices for the rest of 2026
Claude AI's outlook tends to favor Bitcoin prices in the US$80,000 - 90,000 range in the short term, provided that the US$82,000 - 83,000 support zone is maintained. Continued ETF inflows may give BTC price room to retest the $87,300 area and may move towards the $93,000 - 100,000 resistance area identified by Kevin Capital.
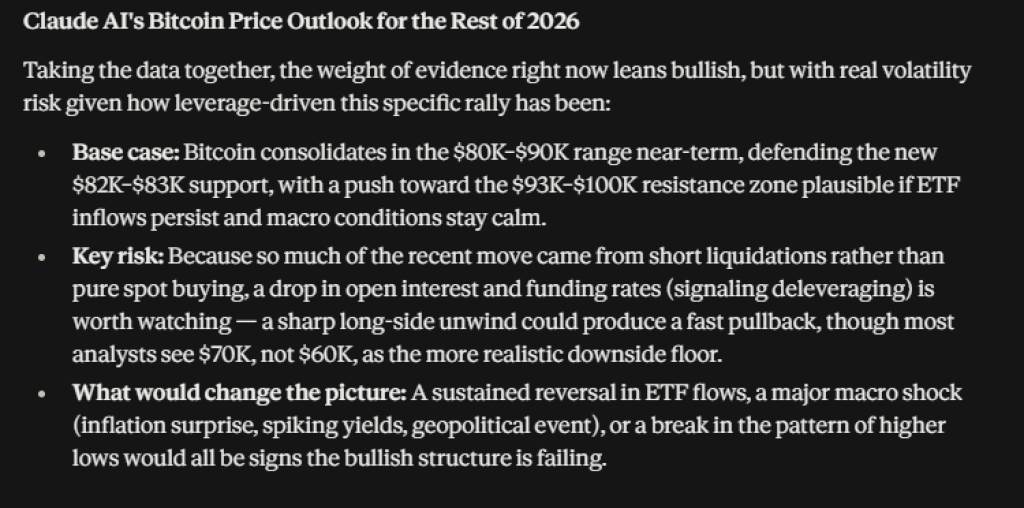
主要风险在于,最近的复苏在很大程度上依赖于衍生品清算。CoinGlass 记录了 1.6856 亿美元的 BTC 空头清算和 3703 万美元的多头清算,这意味着杠杆在这一运动中发挥了重要作用。因此,未平仓合约量和资金费率的下降可能成为清除过度杠杆的重要信号。
持续的 ETF 流出趋势、重大的宏观冲击或比特币更高低点结构的破裂都会削弱看涨案例。目前,数据表明 82,000–83,000 美元位于 60,000 美元之前,是需要关注的关键区域。更深层次的向 60,000 美元的移动可能需要多个看跌因素同时出现,而不仅仅是复苏后的正常回调。
常见问题解答
比特币价格会跌回 60,000 美元吗?
是的,但文章指出了可能需要发生的几个条件,包括持续的比特币 ETF 流出、新的宏观经济压力、上升的国债收益率以及比特币更高低点结构的破裂。首先应关注较近的支撑位 82,000–83,000 美元。
是什么推动了比特币价格的复苏?
复苏得到了强劲的美国现货比特币 ETF 流入和大规模空头清算的支持。比特币 ETF 在 9 月 21 日录得了近 9.99 亿美元的净流入,而在 24 小时内有超过 4.2 亿美元的比特币空头头寸被清算。
Claude AI 对 2026 年剩余时间比特币价格的 outlook 如何?
Claude AI 的基础情景显示,比特币在短期内将在 80,000–90,000 美元区间盘整,如果 ETF 需求持续且比特币保持更高低点,则可能向 93,000–100,000 美元移动。ETF 资金流的持续逆转或重大宏观冲击可能会重新引起市场对 70,000–60,000 美元下行区域的关注。