
 Exchange Ranking
 Top Exchanges
 24h Volume Ranking
 Popularity Ranking
 Exchange BTC Balance
 Proof of Reserves
 Decentralized Exchanges
 Funding Rate
 Funding Heatmap
 Liquidation Data
 Max Pain
 Long/Short Ratio
 Whale L/S Ratio
 Binance/Okex/Huobi L/S
 Bitfinex Margin L/S
 ETF Tracker
 Solana ETF
 XRP ETF
 Hong Kong ETF
 Bitcoin Treasuries
 Crypto Reversal
 Ethereum Reserves
 HyperLiquid Wallet Analysis
 Hyperliquid Whale Watch
 Large Transactions
 On-chain Movement
 Bitcoin ROI
 Stablecoin Market Cap
 Options Analysis
 News
News Articles
 Economic Calendar
 Features
 Wallet
 Contract Calculator


 Security
 Collections
 Watchlist
 Following
 UNI
UNI Uniswap has been one of the most watched DeFi tokens this year, and this week it is in the spotlight again. This Uniswap price forecast analyzes the latest status of the token after a strong intraday market and key factors that will affect the trend in the next few days.
Current price snapshot
UNI's current trading price is US$3.69, up 6.9% in 24 hours, and the intraday price range is US$3.44 to US$3.74. Based on a circulating supply of 625.344 million units, its market value is US$2.305 billion; based on a maximum supply of 1 billion units, the fully diluted valuation is US$3.29 billion. 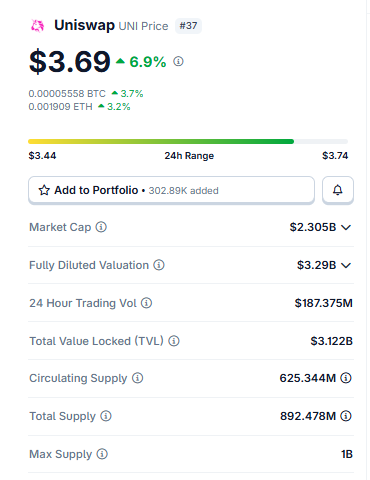 The total supply is 892.478 million units, which means that approximately 267 million units of UNI have not yet entered circulation, which is a potential selling pressure factor worthy of attention in the longer term. The on-chain locked volume (TVL) was US$3.122 billion, and the 24-hour trading volume reached US$187.375 million.
Liquidation data: Shorts paid the price for this round of gains.
The total liquidation amount in the past 24 hours was US$155,8900, of which the short liquidation amount was US$141,500, while the long liquidation amount was only US$14,3900. This situation can be clearly seen from the liquidation heat diagram: 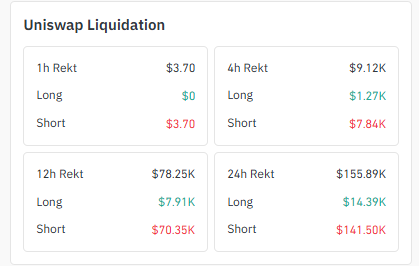
Time range| Total liquidation amount| Long liquidation amount| Short clearing amount
1 hour| $3.70| Approximately $0| US$3.70
4 hours| $9,120| $1,270| US$7840
12 hours| $78.25 million| $7,910| US$70.35 million
24 hours| US$155.89 million| $14.39 million| US$141,500
As prices broke through the trend line, short bets went in the wrong direction and were forced to cover, which further exacerbated the price increase. This provides support for the bullish argument, but is not the final proof.
Exchange trading volume and destruction votes
Binance dominated exchange trading volume, reaching US$71.33 million, ahead of WhiteBit (US$43.38 million) and OKX (US$36.17 million), with Bybit, BingX, LBank, Gate, MEXC and Bitget accounting for smaller shares. 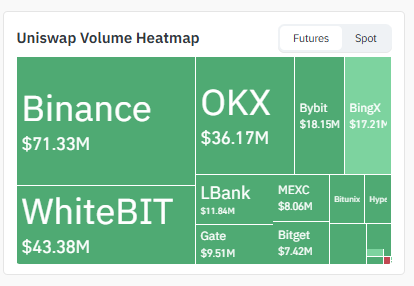 The concentration of Binance and OKX suggests that there is some institutional participation rather than pure retail capital flows.
Market sentiment: Real-time voting on the destruction of UNI
In addition, the Uniswap community is voting on a proposal to expand agreement fees and increase the amount of UNI destroyed, and voting will end in five days. 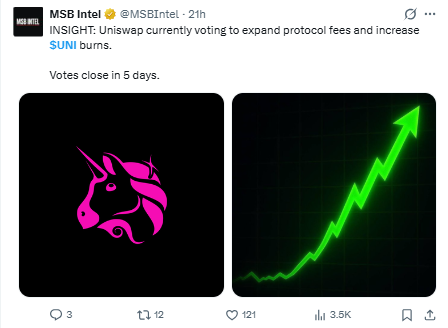 If the proposal passes, it means more agreement revenue will be converted into permanently destroyed UNI, a deflationary mechanism. This vote will coincide with the time window for chart analysis, when technical and fundamental factors will work together rather than alone.
Position concentration
The top 100 wallets control 82.15% of supply, while whale wallets (holding values of more than $1 million) control 96.33% of market value through 855 addresses alone (source: on-chain snapshots). The Gini coefficient is 0.9976. 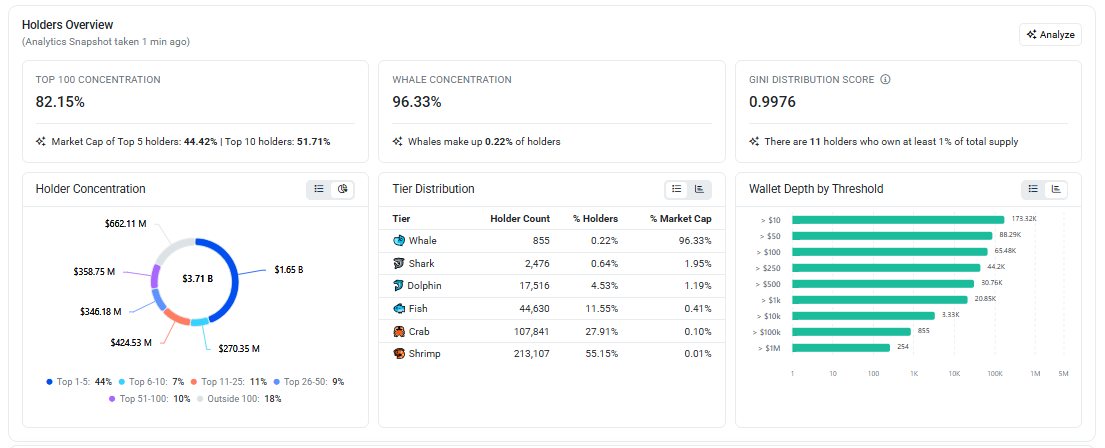 The top 5 wallets alone hold 44.42% of the supply. This high concentration means that large-scale wallet activity, including any voting-related actions, could push prices away from purely chart analysis.
4-hour chart: The trend line has been broken, and a backtest is coming soon
UNI has been sliding along a downtrend line for several weeks, and the price broke through the trend line during this trading session, reaching a peak of US$3.741, and then fell back to US$3.694 (Opening price: $3.726, highest price: $3.741, lowest price: $3.684, closing price: $3.694, down 0.83%). 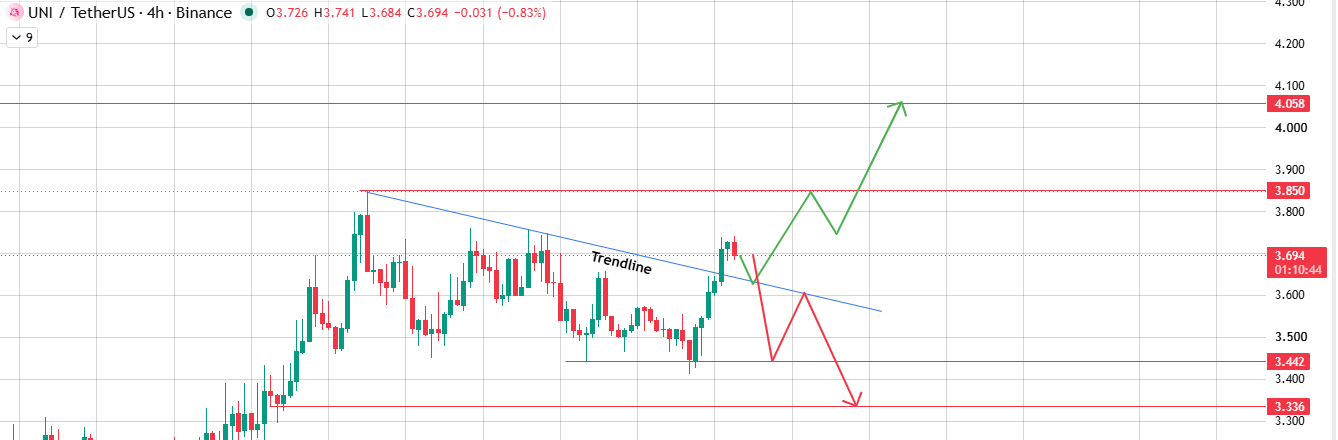 A breakthrough has occurred, and the key now is that the backtest results will determine the direction. If prices rebound from this early resistance level (now support), it will be a continuation of a bullish breakthrough that is expected to point to $3.850 and extend to the target price of $4.058. Failure to hold this support level is a sign of a bearish collapse and prices may fall towards the support area of $3.442, with $3.336 as secondary support.
Daily chart: At the top of the triangular arrangement
On the daily chart, UNI has formed an asymmetric triangular arrangement over the past two months, and prices are currently trading almost exactly at the top of the pattern. 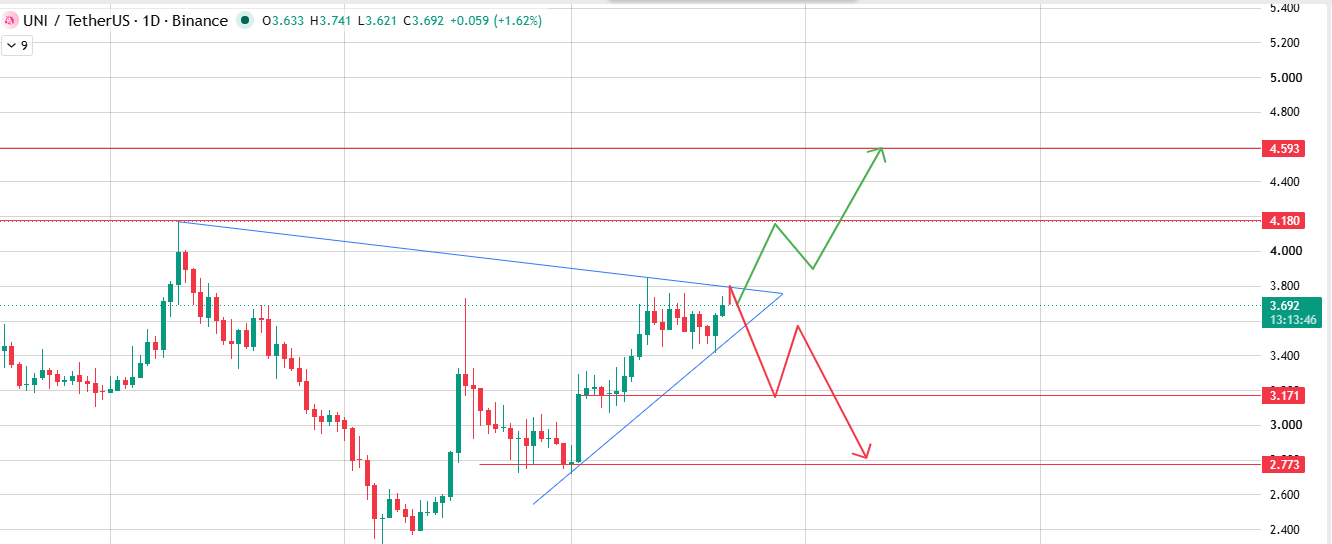 If the daily closing price confirms that it breaks through the upper trend line, it is expected to point to $4.180, then $4.593. If the daily close falls below the trend line below, it may open up space to fall towards $3.171, then $2.773. Failure conditions: A return below $3.44 on the daily closing price will directly negate the bullish outlook. A return to a daily close of $3.85 would negate the bearish outlook.
Key Points
UNI traded at US$3.69, up 6.9% in 24 hours, after breaking through the downtrend line on the 4-hour chart. If the backtest can hold the support level, the range of US$3.850 -4.058 will be opened; if it falls, the possibility of US$3.442 -3.336 will be greater. The daily chart is at the top of a triangle pattern that lasts for several weeks, so a larger move (pointing to $4.180-$4.593, or $3.171-$2.773) could emerge in the next few days. A real-time governance vote aimed at expanding agreement fees and destroying UNI will end in five days, adding a practical fundamental trigger.
Three scenarios price outlook (next 5-10 days)
Bear scenario: The trigger condition is a failure of the backtest and the daily closing price falls below the lower boundary of the triangle. Target price: $3.442 → $3.336 → $3.171/$2.773. Estimated probability: approximately 25%.
Basic scenario: Prices fluctuate between the trend line and the triangular boundary during voting. Target price range: $3.55-$3.85. Estimated probability: approximately 40%.
Bullish scenario: The trigger condition is a successful backtest and the daily closing price breaks through the upper boundary of the triangle. Target price: $3.850 → $4.058 → $4.180-$4.593. Estimated probability: approximately 35%.
The above probabilities are qualitative estimates based on short liquidation skew, pending governance votes, and typical top of a triangle probability. Not a statistical model; the duality of voting results may rewrite the above probabilities.
Risks and factors that may deny this view
Voting result: If the fee switch/destruction proposal is rejected or postponed, even if the chart breaks upward, the bullish momentum will weaken. Bitcoin-led risk aversion: A sharp correction in the overall market is likely to suppress both charts and fundamentals. Unlocking selling pressure: About 267 million UNIs are not in circulation, which is a risk of persistent selling pressure independent of current price levels. Insufficient liquidity: The 24-hour clearing totals just $155.89 million, which is small, meaning moderate order flow can trigger sharp price fluctuations, regardless of direction.
Bitcoin and Ethereum correlation
The trend of UNI is influenced by the trend of Bitcoin dominance and the background that DeFi tokens are typically associated with Ethereum, depending on their activity on the Ethereum network. The stable trend of mainstream currencies provides space for this backtest to develop according to its own logic; while violent fluctuations in Bitcoin or Ethereum are likely to change their trend.
Final Outlook
Double test, same time window: If you can hold the backtest of the 4-hour trend line, then US$3.850 -4.058 is the near-term path; If it falls, US$3.442 -3.336 is more likely. The top of the triangle on the daily chart points to the same fork at a larger level: $4.180 -4.593 or $3.171 -2.773. A real-time destruction vote that will end in five days is directly superimposed on these two key nodes.
Glossary
Trend line backtesting: Prices return to the trend line that was breached to test whether the line can now serve as support or resistance. Symmetric triangle: A neat pattern consisting of convergent trend lines, usually with breakthroughs approaching its top. Failure level: The price point at which a particular trading argument should be abandoned. Liquidation: Forced liquidation of leveraged positions when losses exceed margin.
Methodology
The chart price level is directly derived from TradingView's UNI/USDT 4-hour chart and daily chart, captured at 01:13 and 13:13 Indian Standard Time on July 21, 2026, without any inferences beyond the range shown in the chart. Clearing and volume data are from Coinglass; position data are from on-chain snapshots, obtained approximately one minute before review. The details of the governance vote are from a public platform X post that has not been independently verified with the official Uniswap forum; before taking action based on this, please confirm its current status. Scenario probabilities are qualitative estimates and non-statistical predictions. Open position and fund rate data were not available at the time of writing. This article is for reference only and does not constitute financial advice.






















