
 Exchange Ranking
 Top Exchanges
 24h Volume Ranking
 Popularity Ranking
 Exchange BTC Balance
 Proof of Reserves
 Decentralized Exchanges
 Funding Rate
 Funding Heatmap
 Liquidation Data
 Max Pain
 Long/Short Ratio
 Whale L/S Ratio
 Binance/Okex/Huobi L/S
 Bitfinex Margin L/S
 ETF Tracker
 Solana ETF
 XRP ETF
 Hong Kong ETF
 Bitcoin Treasuries
 Crypto Reversal
 Ethereum Reserves
 HyperLiquid Wallet Analysis
 Hyperliquid Whale Watch
 Large Transactions
 On-chain Movement
 Bitcoin ROI
 Stablecoin Market Cap
 Options Analysis
 News
News Articles
 Economic Calendar
 Features
 Wallet
 Contract Calculator


 Security
 Collections
 Watchlist
 Following
 BTC
BTC  ETH
ETH  SOL
SOL  XRP
XRP More than 260 days have passed since the last confirmed altcoin season
This is likely to be the longest window on record. Traders have been waiting for the altcoin to outperform Bitcoin, but this never happens.
CoinMarketCap's Altcoins Seasonal Index measures how many Altcoins perform better than Bitcoin. When 75 of the top 100 currencies have increased more than Bitcoin in the past 90 days, the index switches to the "altcoin season" status. 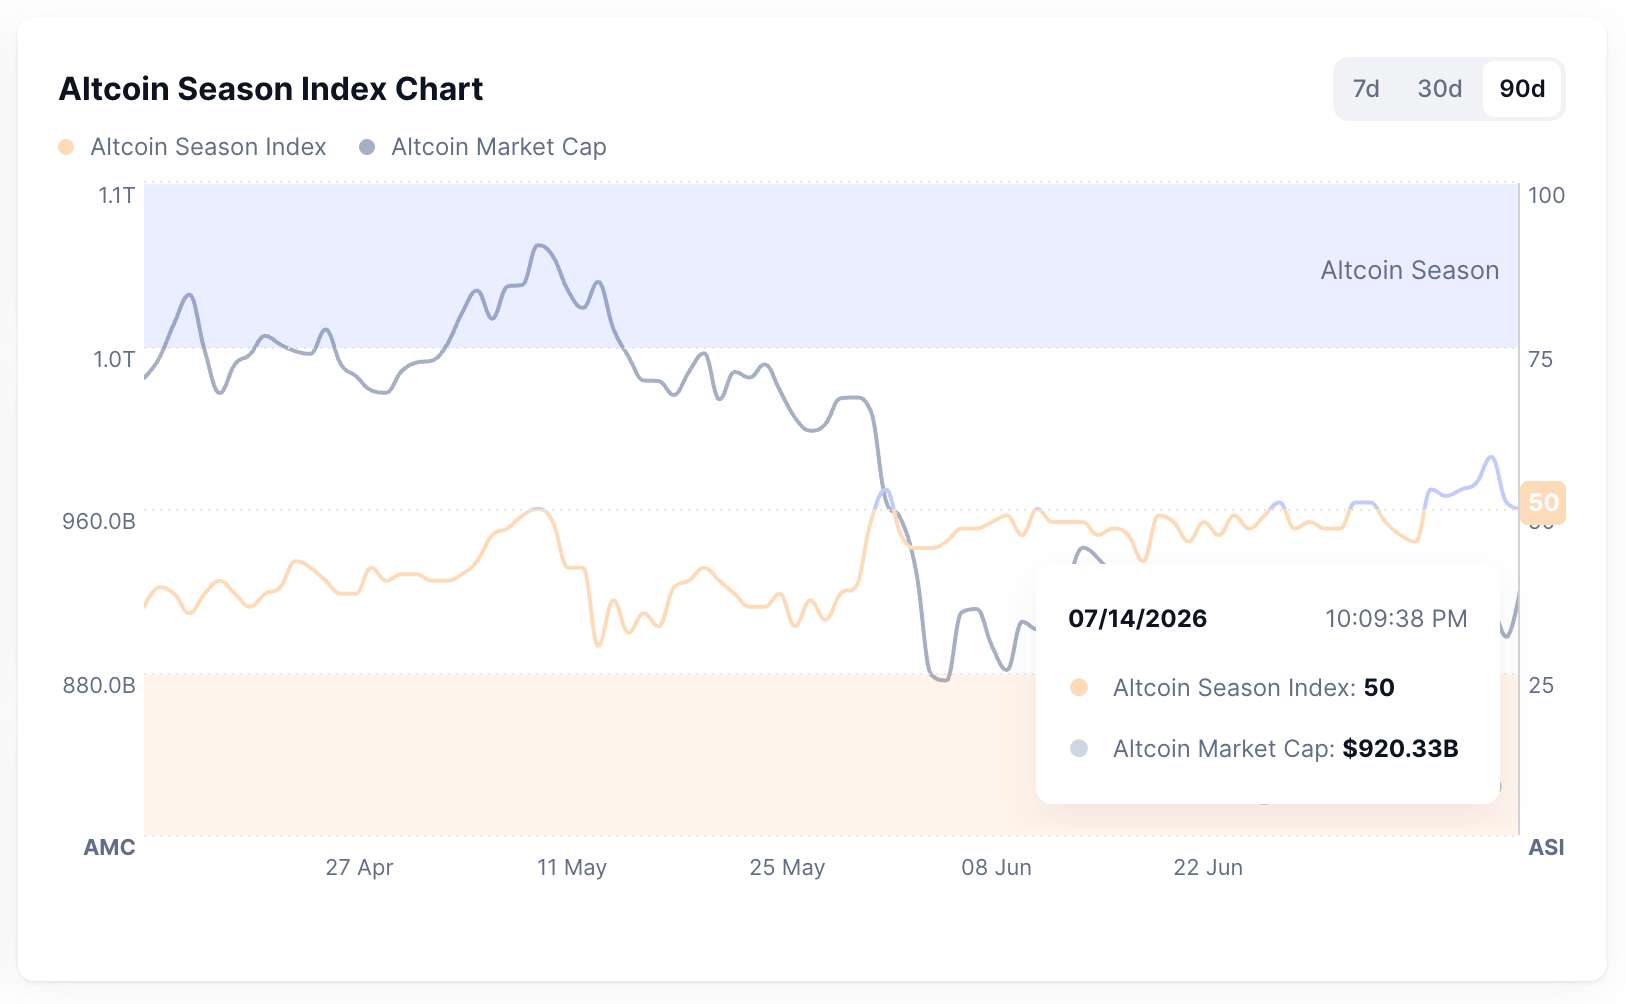
In December 2024, the index once hit 89, meaning that almost all major currencies outperformed Bitcoin at the same time. Currently, it is stuck in the range of 45 to 50, which means that Bitcoin still outperforms most altcoins, and this state has lasted for most of the year.
Meanwhile, Bitcoin dominance is 58% at the time of writing. Retail traders are staring at that number, waiting for their usual action: cashing in on Bitcoin profits and buying smaller currencies that are more volatile and riskier. 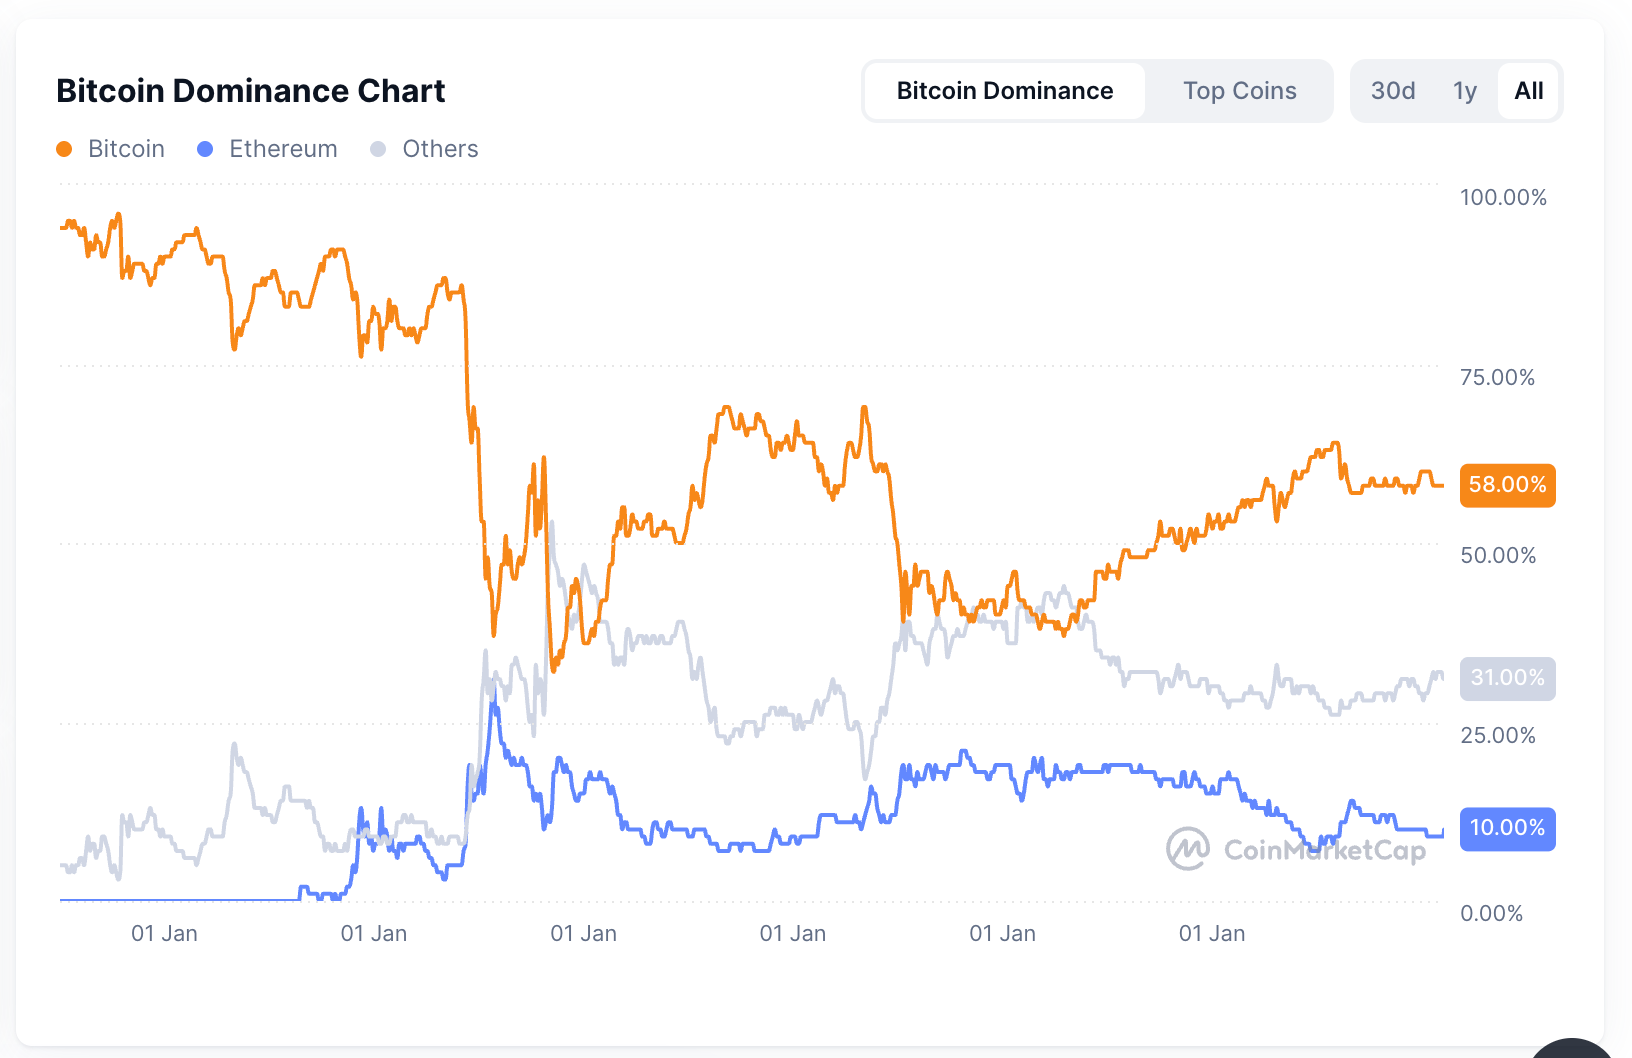
This year, this action has not happened yet. To make matters worse, the altcoins failed to even stabilize their prices while waiting. From an October 2025 peak to mid-2026, large altcoins have fallen by the same size as Bitcoin, and some are even worse. Bitcoin fell by about 43%, while Ethereum and Ripple each fell by about 60%, and Solana fell by about 70%.
The real question is not whether the altcoin season is late, but whether the conditions that spawned the 2021 altcoin season still exist. Below we will compare these conditions one by one with real-time data for 2026.
Bitcoin dominance: The key number that determines capital rotation
Traders will pay close attention to whether Bitcoin dominance shows a downward trend, because one of the factors driving its downward trend is the flow of funds into altcoins. But so far, dominance has remained firmly above 55%, even soaring to 60.6% in early May, never falling below the 55% mark that analysts regard as a signal of widespread rotation. 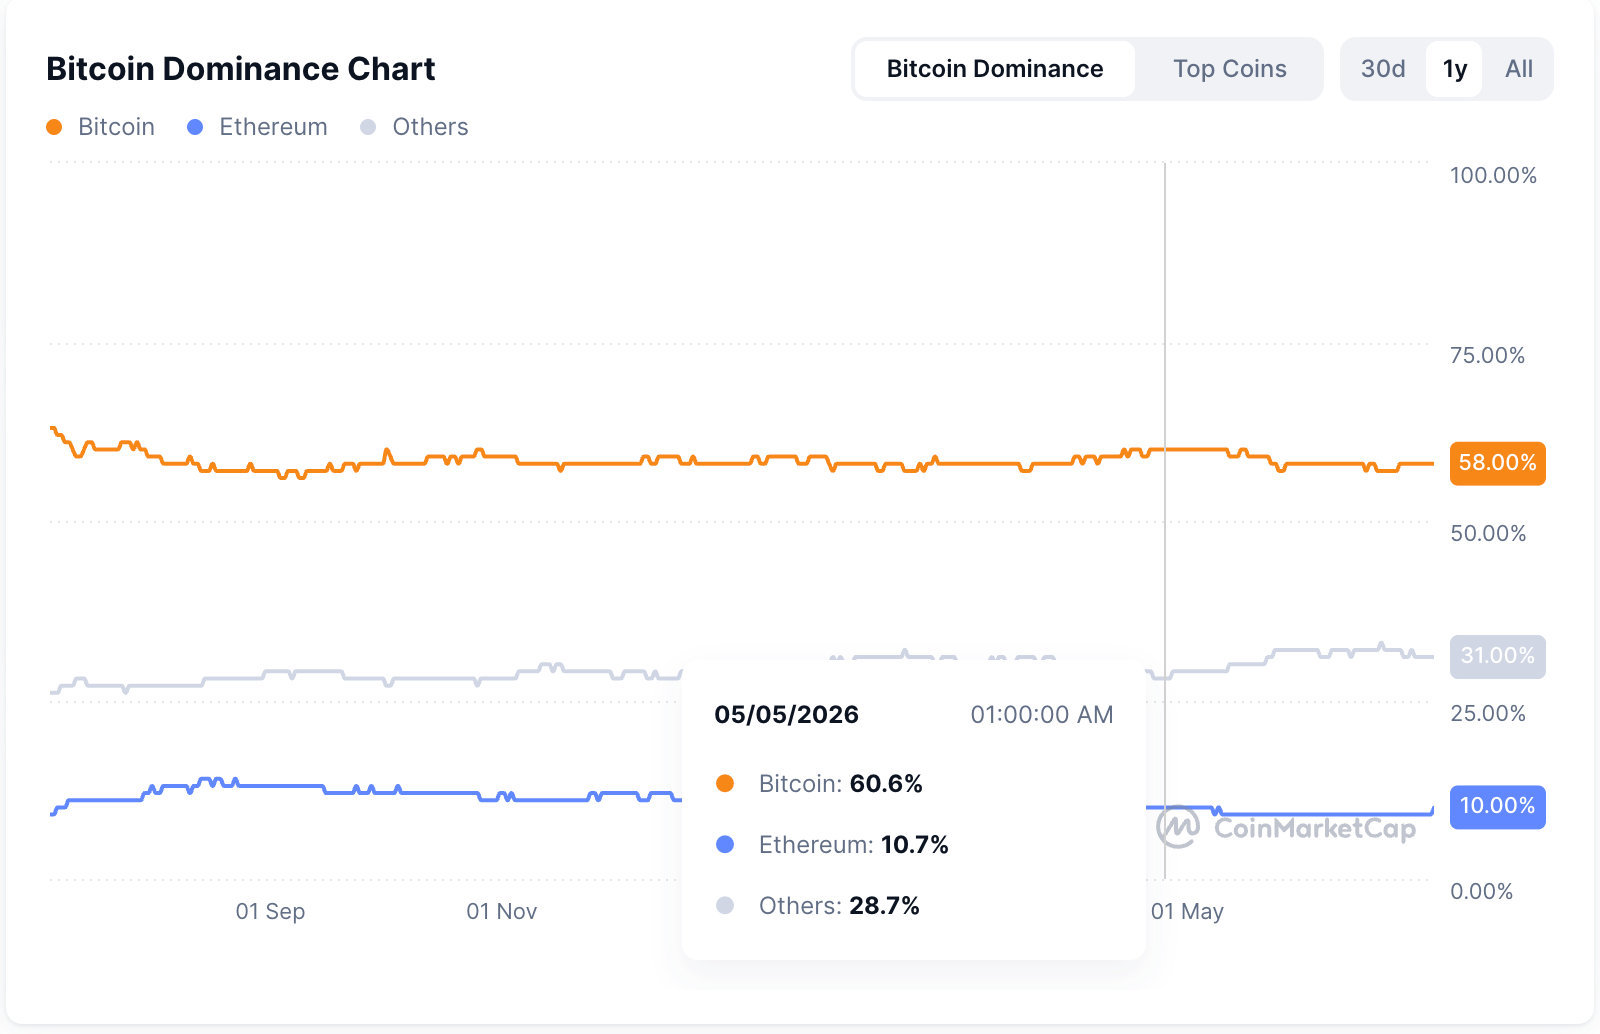
For comparison, in 2021, Bitcoin's dominance dropped significantly from about 70% at the beginning of the year to 38% to 40% in mid-May, as funds poured into all other currencies. The dominant position remains above 50%, which means that funds are still in Bitcoin rather than flowing out. But here's a trap: Not every decline is a bullish signal. When Bitcoin falls more than altcoins, its dominance also declines, and no one can make money in this case. Stable coins are included in the total market value together with altcoins, so an increase in the number of stable coins on the chain may also reduce Bitcoin's dominance without any rotation.
The Wall of ETF: Where Big Money Stops
The types of buyers with the ability to drive price fluctuations have changed, and the paths for money to enter the market have also changed. Spot bitcoin exchange-traded funds were launched in the United States in January 2024 and have become the main method for institutions to purchase cryptocurrencies. Funds flowing in through Bitcoin ETFs often stay inside Bitcoin. The fund can only hold bitcoin, so the funds cannot be diverted to altcoins like retail traders do. Even if investors withdraw funds from funds, they tend to turn their money back into cash rather than buy altcoins.
This can be seen in the flow of funds. In the last week of May 2026, cryptocurrency funds suffered US$1.67 billion in outflows, of which Bitcoin alone accounted for US$1.44 billion, accounting for approximately 86% of the total outflows. These funds barely flowed into altcoin funds, but left the entire system, becoming the second-largest outflow week in 2026.
The wall is cracking, but it is also selective. The U.S. Securities and Exchange Commission approved common listing standards in September 2025, shortening the approval process that originally exceeded 200 days, and Solana and XRP ETFs were subsequently approved. But while Bitcoin and Ethereum funds were losing money, the two ETFs combined attracted only approximately US$122.7 million in the week ended May 18, 2026.
The Bitcoin capital drain that began in May later became the longest on record, with eight consecutive weeks of capital outflows totaling approximately US$8.2 billion. 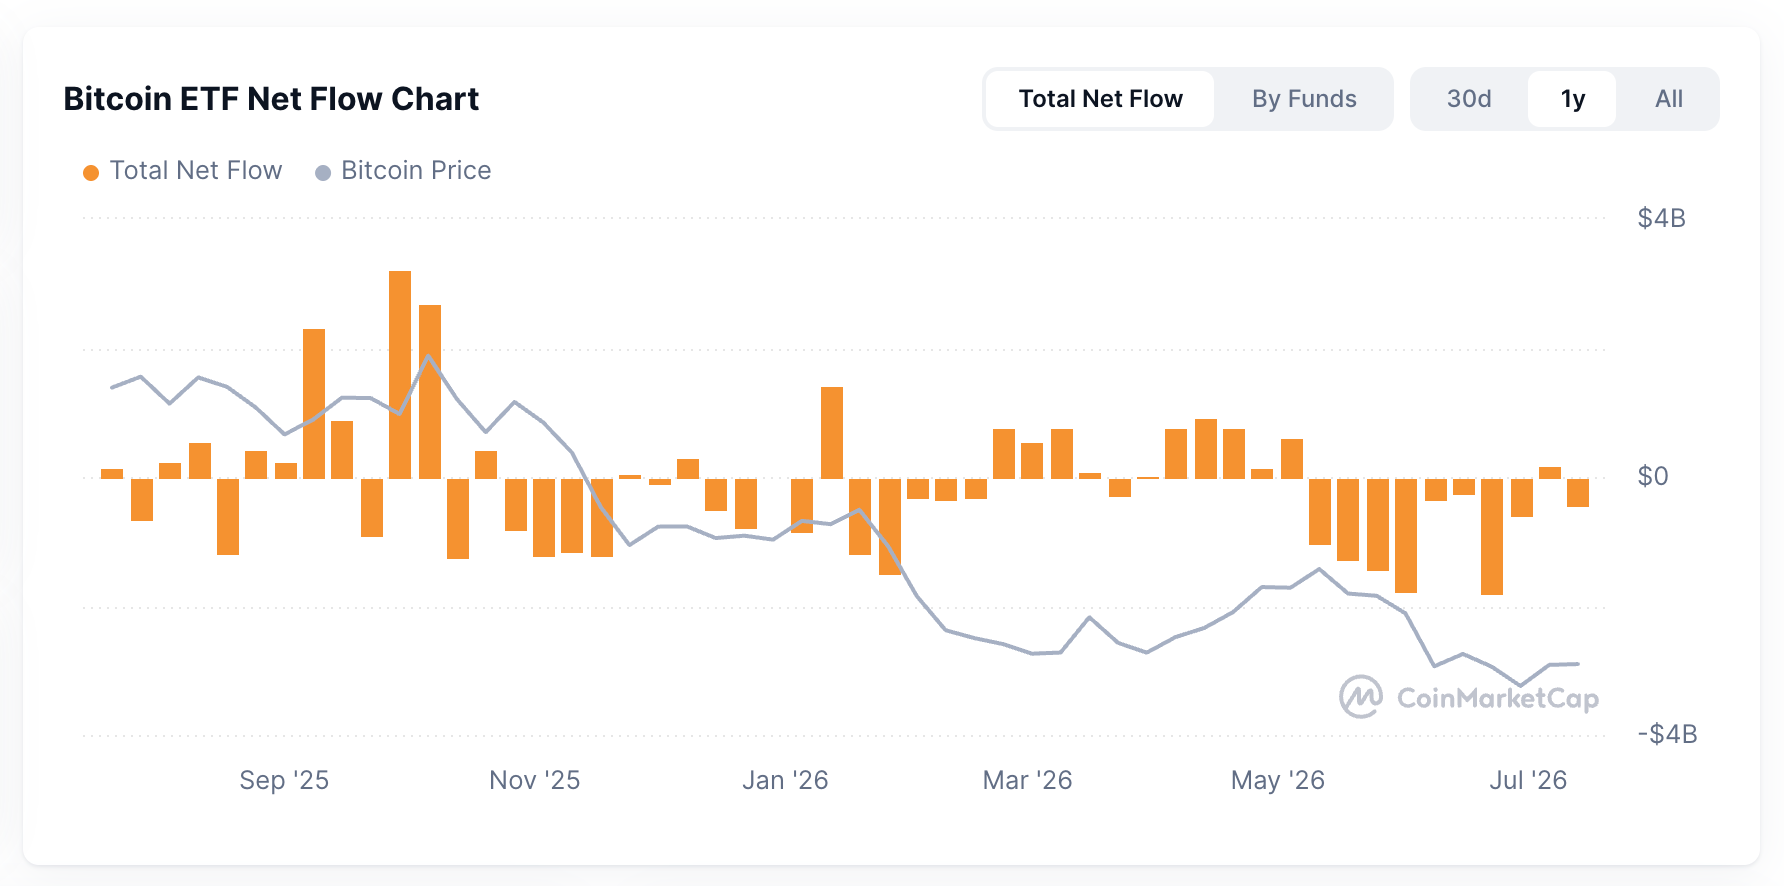
From a more macro perspective, this is the real change since 2021. In the past, the main new buyers were retail traders spreading bets among dozens of altcoins, but now they are institutions buying one asset at a time through single-currency funds. As a result, funds are locked in a single currency and will not spread to the entire altcoin market.
Too many tokens, too little capital
Even if demand returns in 2021, it will face a completely different supply side. There are millions of cryptocurrency tokens in existence today, compared with only a few thousand in 2021. 
Moreover, many of these new supplies have very little circulation during the initial stage of listing. A large number of tokens have been locked and are planned to be released one after another in accordance with the "token unlocking" schedule in the future. Most unlocks cause prices to fall, and selling often begins weeks in advance due to market expectations of selling. This creates two problems with new demand: first, the same funds need to be spread across more tokens; second, many tokens must absorb new sellers 'supplies on a fixed schedule, whether or not new buyers emerge.
The funds are still there, but they have not flowed to the altcoin.
Liquidity has not disappeared, but it has not flowed to the altcoin because the trading depth of the altcoin market has become thinner. The total locked position value of decentralized finance was US$75.2 billion at the time of writing, a year-on-year decrease of 34% and a 56.9% decrease from the historical high in November 2021. 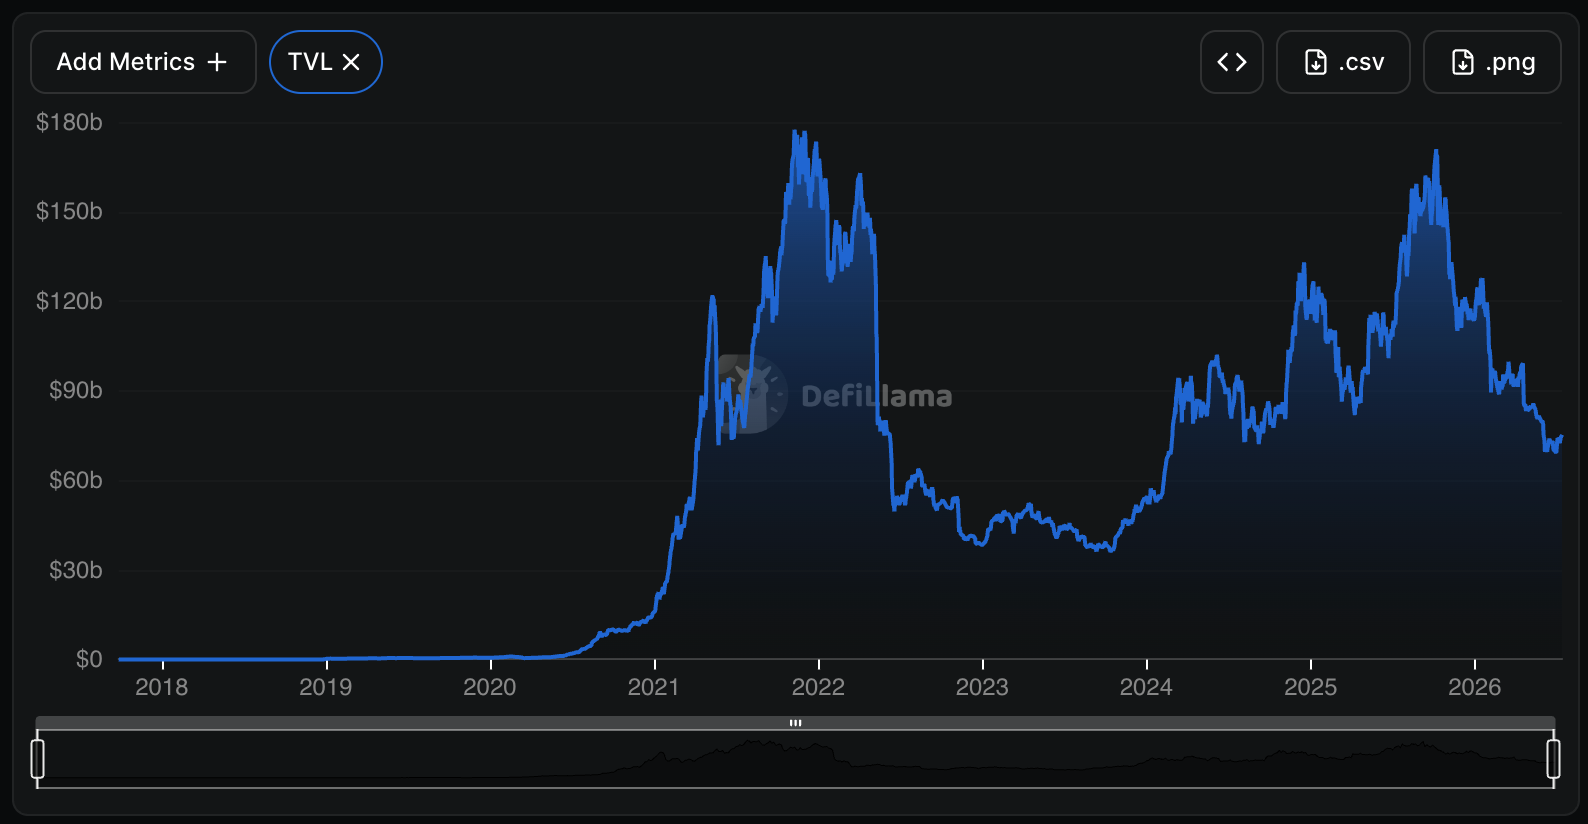
Currently, only 33 cryptocurrencies can have a 24-hour trading volume of more than US$200 million, so large funds cannot move in and out freely without impacting prices. At the same time, even as altcoin prices fell, the supply of stablecoins has grown to about US$308 billion in the past year. These funds are parked there, ready to buy at any time. So why didn't they flow into altcoins? 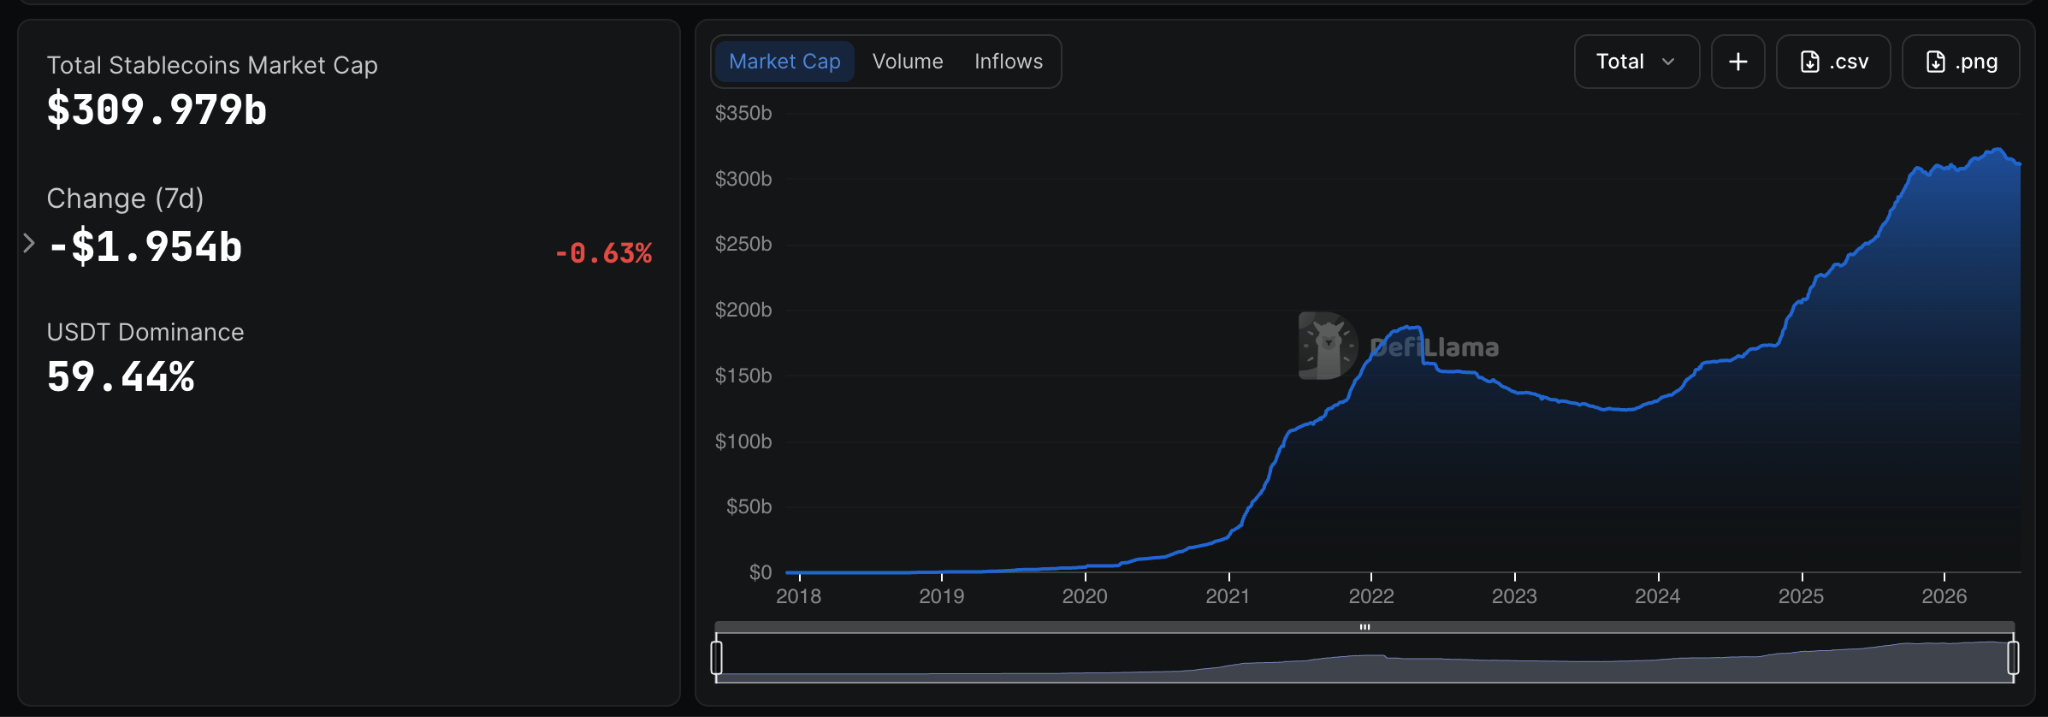
The safest funds pools can only provide low single-digit dollar returns, such as Sky's sUSDS with an annualized yield of 3.60%, Maple's USDC with 4.91%. The Federal Reserve will keep interest rates in the range of 3.50% to 3.75% in July 2026, while inflation is close to 3.8%. Interest income on cash and stablecoins will be close to zero in 2021, so investors will have to bear the additional risk of altcoins in order to get any return. Today, the same money parked in a low-risk loan pool can earn a return of 3% to 5%. The money that may flow into altcoins still exists, but they no longer need to flow to generate benefits.
Ethereum is absent, no one leads the gains
The broad altcoin season always requires a leader, and this role has historically been played by Ethereum. As the foundation of the largest altcoin and most other altcoins, when Ethereum outperforms Bitcoin, other currencies tend to follow suit. The signal to pay attention to is the ETH/BTC ratio, which is how much Bitcoin an Ethereum is worth. When the ratio rises, it means that Ethereum is outperforming Bitcoin, which is a condition required for funding rotation. But the ratio is currently falling, hitting a 10-month low of 0.026 in June 2026, down more than 40% from its August peak. 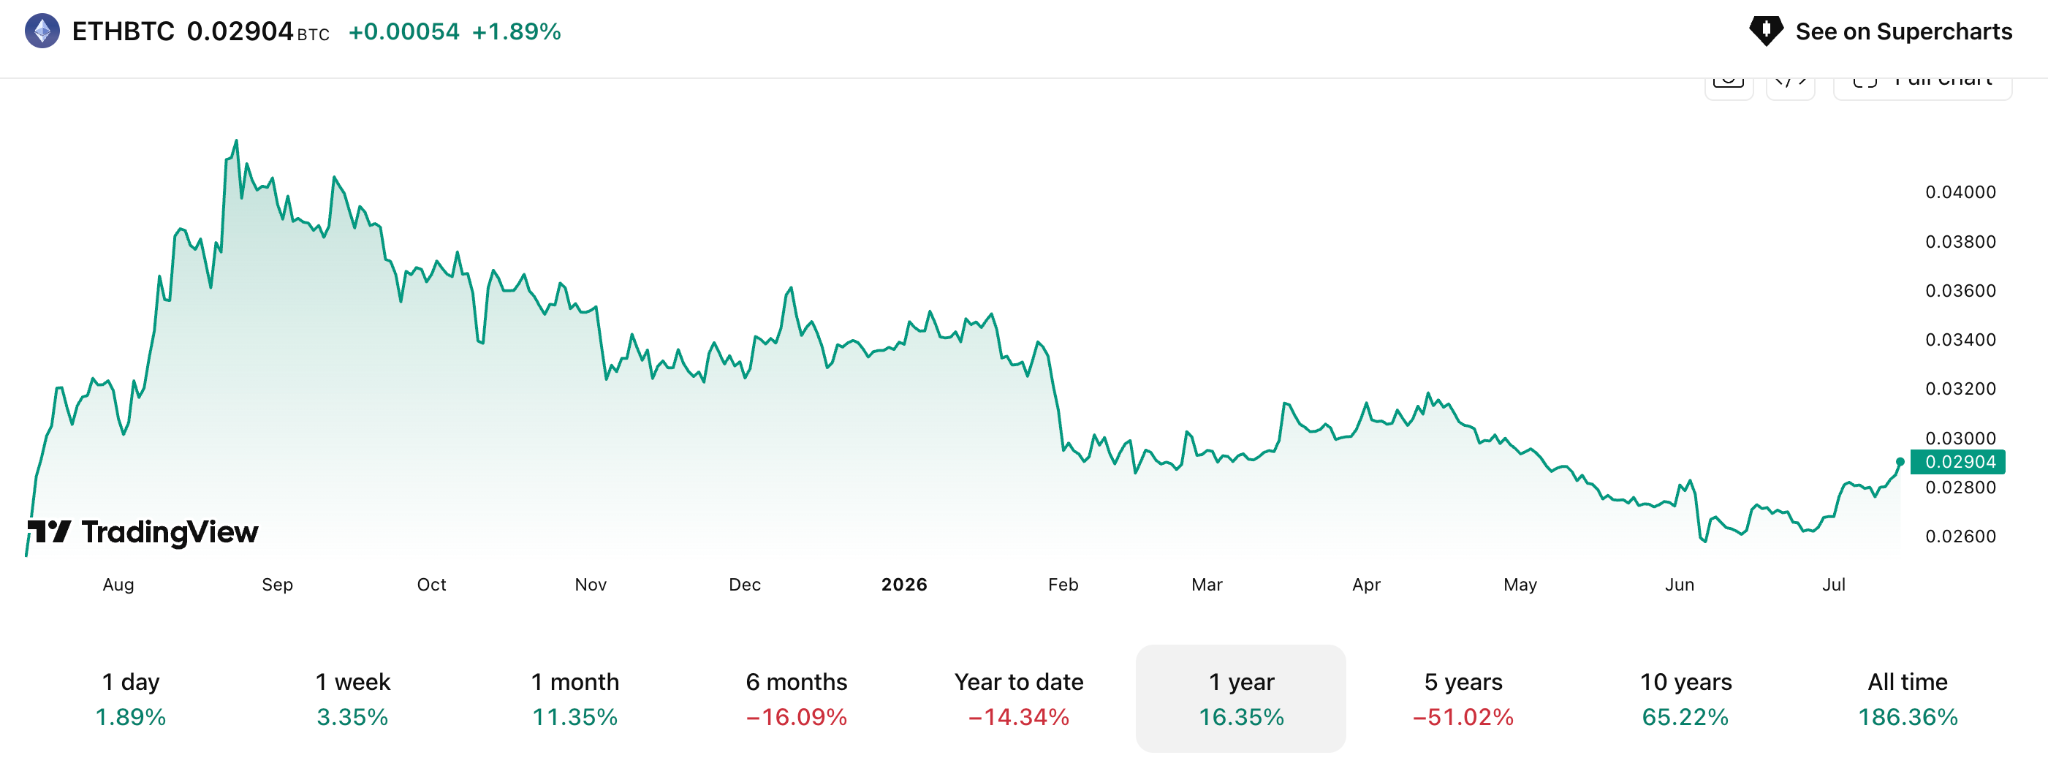
This puts Ethereum well below its 200-week moving average of about 0.048, which is the long-term benchmark that traders view as a bottom. Ethereum was also weak against the dollar, down about 62% from its all-time high to below $1800. This means that Ethereum itself is no longer able to drive the entire market upward. There are several reasons for this gap: Ethereum is now more closely correlated with the Nasdaq Technology Index, and it falls whenever the stock market falls; its ETF demand is weak; it is not hoarded by corporate treasuries like Bitcoin; and, the Layer-2 network shifts fee activity away from the main chain, resulting in less burning ETH.
However, don't view current weakness as permanent. The low ETH/BTC ratio only describes Ethereum's recent trading situation, which has rebounded from lows in the past.
Is it selective increase or is it just late?
There will still be capital rotation in 2026, but in the form of a short-lived, narration-driven pulse increase rather than the "everything goes up" wave in 2021. Money will now flow into several topics (such as real-world assets, AI tokens, DePIN hardware networks), but it will not drive the entire market up. Part of the reason for the narrowing of the range of rotation is the drying up of speculative funds. The total market value of Meme coins peaked at approximately US$150 billion at the end of 2024, and has since dropped to approximately US$25 billion, a drop of more than 80%.
The two biggest obstacles to date-high interest rates and parked stablecoins-are both reversible. Interest rates can fall, and once they fall, parked dollars can flow quickly. Still, what keeps capital cautious is a series of risks that do not exist in 2021. The market prices of listed companies that have included cryptocurrencies on their balance sheets and are under pressure as a result, as well as most listed and traded bitcoin treasury bonds, are already below the market value of the cryptocurrencies they hold.
Security risks are another cost that drags down the market. The largest DeFi attack in 2026 occurred in April, when approximately $292 million was stolen from a cross-chain bridge, which is the infrastructure that altcoin funds must pass through to flow between different chains. Clearer regulatory rules for cryptocurrencies in the United States have also been repeatedly postponed. The CLARITY Act, which aims to divide regulatory powers between the SEC and the CFTC, currently faces a Senate vote around July 20, and the probability of passage is roughly equal.
Therefore, use the "selective altcoin season" as an organizational idea to observe the market rather than make predictions about timing or price.
What really needs to be focused on
Every condition in 2021 has changed. The token pool has increased from a few thousand to more than 10 million. The main new buyers have shifted from retail traders to institutions gradually entering through single-asset ETFs. Cash (or stablecoins) can now earn between 3.50% and 3.75% instead of zero, so these funds stay in the U.S. dollar. Ethereum, which once led the movement, is currently at its weakest exchange rate against Bitcoin since mid-2025.
Since 2021, the market landscape has changed. So, forget the calendar and focus on three numbers:
Bitcoin dominance fell below and remained below the roughly 55% mark that analysts are focusing on
The ETH/BTC ratio rebounded to near its long-term average of 0.048
The Altcoin Seasonal Index exceeded 75
In the past, these three indicators moved in the same direction at the same time, signaling the arrival of widespread rotation. At present, these three indicators are still conveying the same message: "The time is not yet."






















