
 Exchange Ranking
 Top Exchanges
 24h Volume Ranking
 Popularity Ranking
 Exchange BTC Balance
 Proof of Reserves
 Decentralized Exchanges
 Funding Rate
 Funding Heatmap
 Liquidation Data
 Max Pain
 Long/Short Ratio
 Whale L/S Ratio
 Binance/Okex/Huobi L/S
 Bitfinex Margin L/S
 ETF Tracker
 Solana ETF
 XRP ETF
 Hong Kong ETF
 Bitcoin Treasuries
 Crypto Reversal
 Ethereum Reserves
 HyperLiquid Wallet Analysis
 Hyperliquid Whale Watch
 Large Transactions
 On-chain Movement
 Bitcoin ROI
 Stablecoin Market Cap
 Options Analysis
 News
News Articles
 Economic Calendar
 Features
 Wallet
 Contract Calculator


 Security
 Collections
 Watchlist
 Following
 M
M MemeCore (M) has quietly recovered from recent lows, rising 8.61% in the past 24 hours and trading close to $1.08. But what really deserves attention is not this rebound, but the breakthrough pattern that is taking shape on the chart. The 4-hour chart has successfully broken through its downward channel, while the daily chart is still trying to break through the same structure that has been suppressing prices for weeks. This difference between time frames is what makes MemeCore price forecasts worth noting: Is M really turning around, or is this just another brief recovery in a long-term downward trend?
Is MemeCore's recovery gathering real momentum?
M recorded an increase of 8.61% in 24 hours, particularly prominent in the recent overall weak performance. At the same time, buyers are trying to regain control from the downtrend that has dominated the market in the past few months. The rally was not driven by new news and appeared to be purely a technical recovery-prices rebounded from lows and hit resistance. The question is whether this marks an early stage of a trend reversal or is it just a soothing rebound in fragile structures? Kinetic energy has improved significantly, but has not yet been verified over a longer period of time.
Does MemeCore derivatives data confirm a rebound?
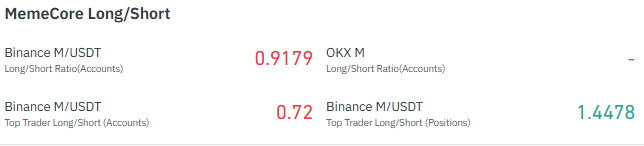
Open interest volume was US$20.59 million, down from a July high of approximately US$28 million, indicating that traders did not increase their pursuit of gains, but reduced leverage levels. 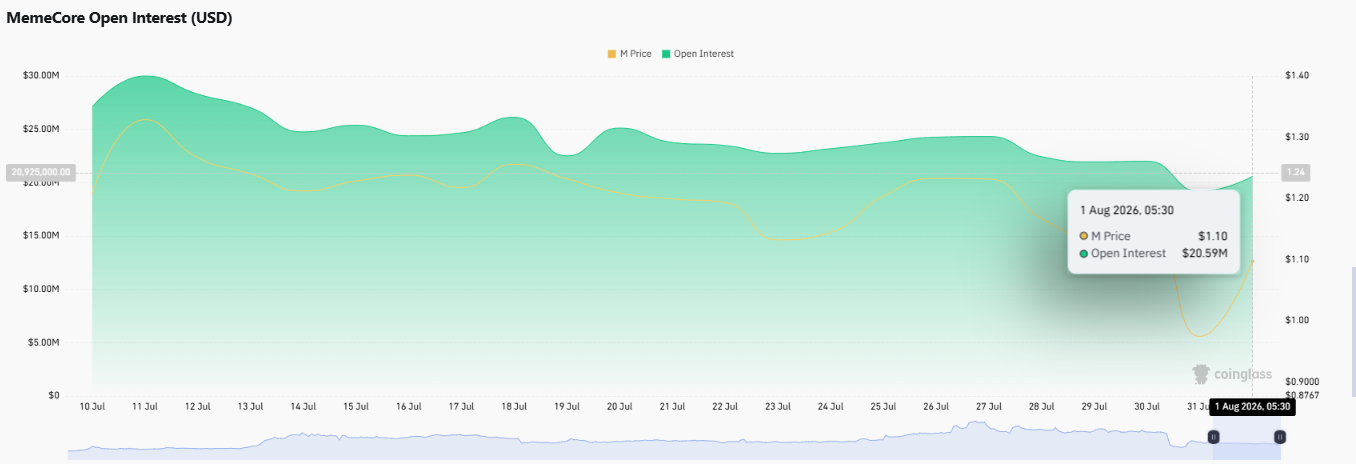 The position situation is quite differentiated: the long-short ratio of Binan accounts is 0.9179, which is slightly short; the top traders of Binan also have different opinions. The short tendency at the account level is 0.72, but the positions of top traders are biased towards long positions at 1.4478.
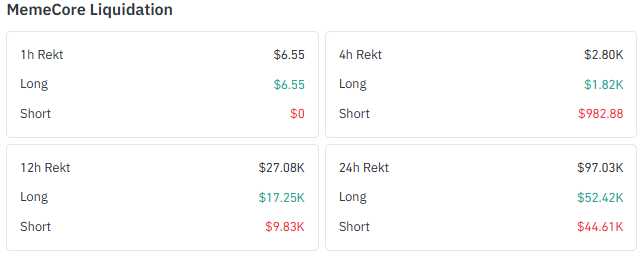
  In the past 24 hours, the total liquidation amount was US$97.03 million, of which long liquidation (US$52.42 million) was slightly higher than short liquidation (US$44.61 million).
  Overall, derivatives data shows that markets are cautious rather than confident, and there is no clear unilateral bet behind this recovery.
Is MemeCore recovering or still under pressure?
MemeCore's short-term data was encouraging, rising 8.61% in 24 hours, but this occurred against the backdrop of a more severe long-term trend. 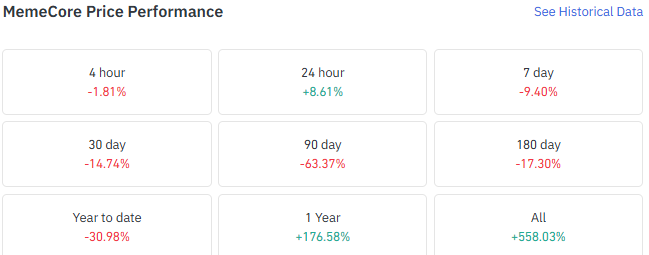 The token fell 9.40% in 7 days, 14.74% in 30 days, 63.37% in 90 days, and 30.98% year-to-date. However, when the time span is lengthened, the situation is completely different: M still rose by 176.58% in the past year. The recent rebound is a bright spot in a long and uneven trend.
Has the 4-hour chart achieved a breakthrough?
On the 4-hour TradingView chart,$M has broken through its downtrend channel and is trading close to US$1.0849, with an RSI of 47.75, still below the median but recovering. Resistance is at $1.16690,$1.31864 and $1.50664, while support is stratified at $0.98887,$0.92314 and $0.85490. 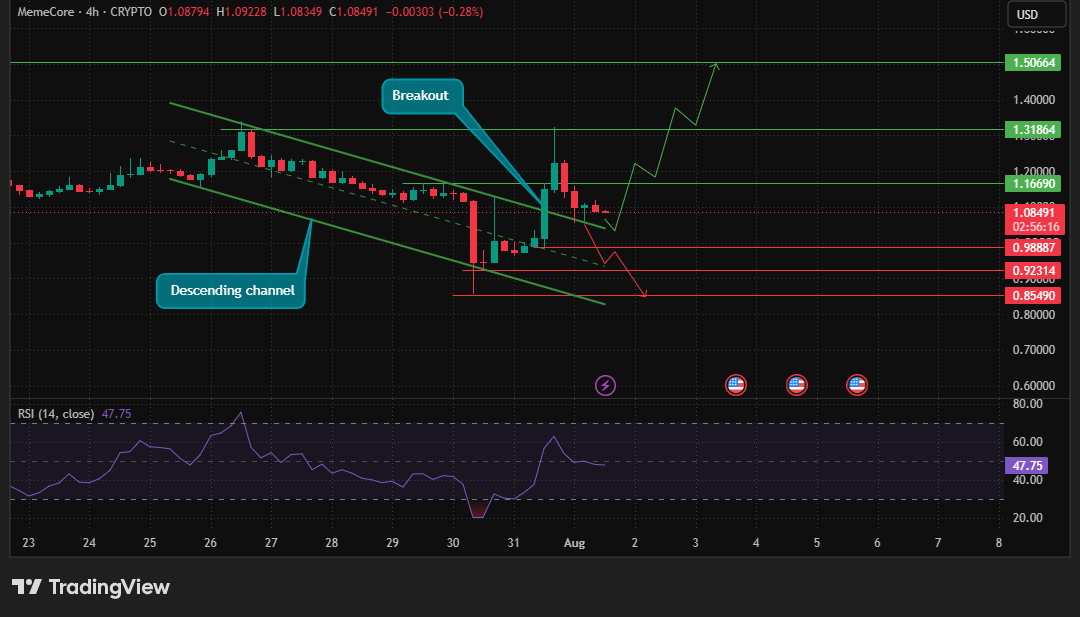 This breakthrough is encouraging, but early: buyers need to hold above $0.98887 to maintain structural integrity, and confirmation that a breakthrough of $1.16690 will strengthen the argument that short-term trends have truly shifted.
Can MemeCore get rid of the daily decline channel?
The daily chart tells a more cautious story. M is still in the downtrend channel that has defined price movements since June, and the RSI of 39.33 remains in a weak area. 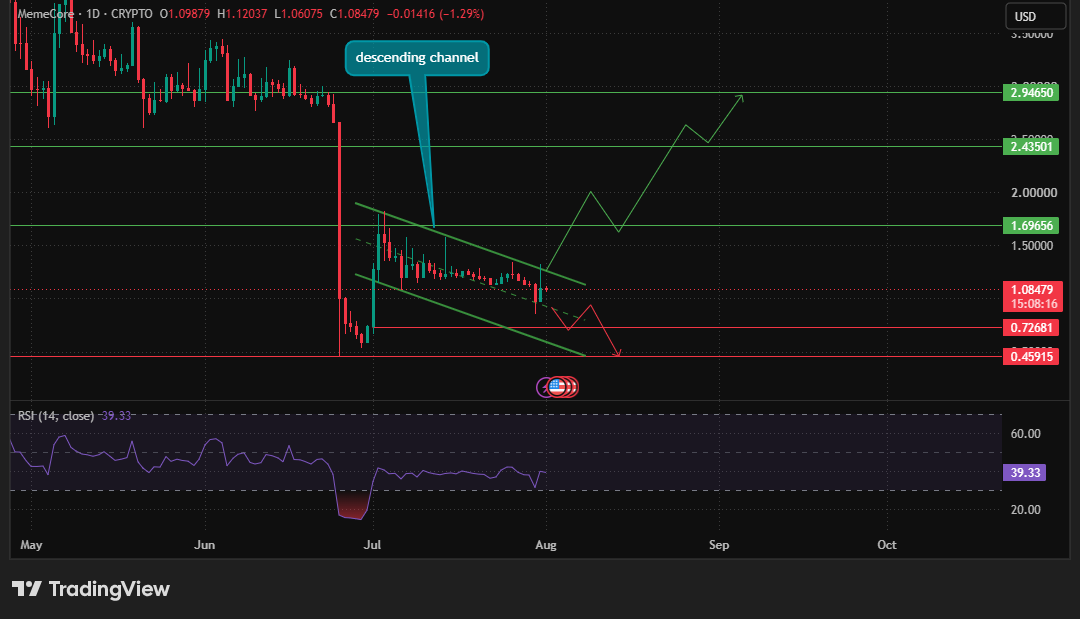 Resistance levels are at $1.69656,$2.43501 and $2.94650, and these levels will only come into play if the channel is decisively breached. On the downside, support levels are at US$0.72681 and US$0.45915. Confirming the breakthrough channel will open the door to higher resistance areas, but until then, MemeCore's higher time frame trend remains bearish, and the recent rebound still requires confirmation at the daily level.
How will MemeCore perform next?
The following scenarios are built based on the above technical bits.
Bullish scenario
Trigger conditions: A confirmed breakthrough of US$1.16690, accompanied by a breakthrough in the daily channel. Target outlook: Open the path to US$1.31864 and US$1.50664. If the daily break continues, US$1.69656 will come into view.
Benchmark scenario
Trigger: Price fluctuates between US$0.98887 and US$1.16690. Target outlook: The market digested and rebounded, continued to consolidate, and neither long nor short sides clearly controlled the situation.
Bear scenario
Trigger condition: Break below the US$0.98887 support level. Target outlook: Re-open the downside to US$0.92314 and US$0.85490, keeping the bearish structure of the daily channel intact.
How should traders interpret the current landscape?
$M has broken through its downtrend channel and briefly tested the $1.31864 resistance level before withdrawing back to re-test the breakthrough area. If we can hold the top of the channel with volume, it will strengthen the bullish structure and may trigger another round of gains to US$1.50664. However, if the breakthrough level cannot be held, prices will fall back into the channel, turning recent movements into false breakthroughs and increasing the possibility of range trading.






















