
 Exchange Ranking
 Top Exchanges
 24h Volume Ranking
 Popularity Ranking
 Exchange BTC Balance
 Proof of Reserves
 Decentralized Exchanges
 Funding Rate
 Funding Heatmap
 Liquidation Data
 Max Pain
 Long/Short Ratio
 Whale L/S Ratio
 Binance/Okex/Huobi L/S
 Bitfinex Margin L/S
 ETF Tracker
 Solana ETF
 XRP ETF
 Hong Kong ETF
 Bitcoin Treasuries
 Crypto Reversal
 Ethereum Reserves
 HyperLiquid Wallet Analysis
 Hyperliquid Whale Watch
 Large Transactions
 On-chain Movement
 Bitcoin ROI
 Stablecoin Market Cap
 Options Analysis
 News
News Articles
 Economic Calendar
 Features
 Wallet
 Contract Calculator


 Security
 Collections
 Watchlist
 Following
 SHIB
SHIB SHIB Price Outlook: Many parties adhere to long-term support, and momentum indicators are beginning to improve.
SHIB has maintained important long-term support areas while testing trend line resistance and improving weekly momentum indicators. Prices remained around US$0.000046 as bearish pressure on MACD weakened and the RSI stabilized below the central axis. Fibonacci projection targets are still valid, but it is confirmed that prices still need to continue to break through resistance.
The SHIB price outlook has attracted much attention, and Shiba Inu Coin is testing resistance while adhering to long-term support. Kinetic indicators show conditions are improving, but confirmation of a broader trend reversal remains to be verified.
Long-term support remains effective
The weekly chart shows the market cycle of SHIB since its rise in 2021, tracking subsequent corrections and long-term consolidation. Structurally, the collapse, retracement and fundraising stages can be identified. 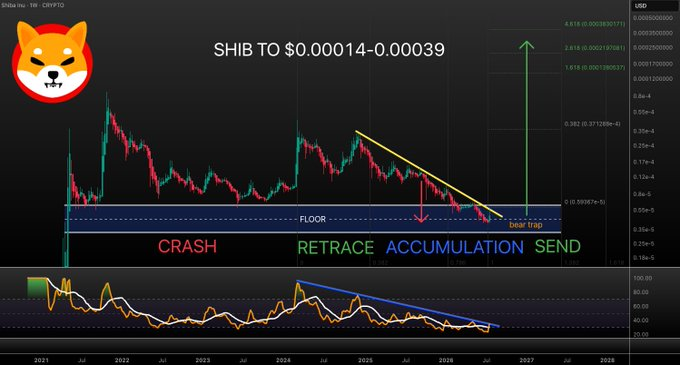
A broad blue support area continues to serve as the bottom of the market. Prices have tested the area many times, but no weekly breaks have occurred. Amid recent weaknesses, buyers continue to defend this level. The chart also shows resistance to a downtrend line extending from previous highs. Prices have been shrinking below this barrier for months, and the narrowing structure suggests a decisive market may be approaching.
Relevant market developments are posted through SHIBMoral's posts. The post pointed out that despite resistance tests, the bottom remains solid, but the market still needs to confirm the signal further.
Improved conditions for kinetic energy indicator display
The weekly relative strength index (RSI) has leveled off after continuing to fall. A falling RSI resistance line is still under pressure, with current momentum significantly stronger than during previous downturns. Charts link price movements to improved weekly RSI behavior, and the two indicators are working together to test key technical resistance levels. Traders often focus on this synchronous signal before stronger directional movements emerge.
The Fibonacci expansion level is a further target after potential upward confirmation, with a projection range of approximately US$0.00014 to US$0.00039. These levels are only technical predictions and are not guaranteed results. The chart also marks possible short traps below the support level. Such patterns often attract sellers to enter the market and rebound quickly, but confirm that continued buying activities are still needed in the future.
SHIB holds steady near near-term support
The four-hour chart provides a more short-term market background. SHIB was recently confirmed at around US$0.0000055, then entered a correction phase, and finally stabilized at US$0.000046 after selling weakened. 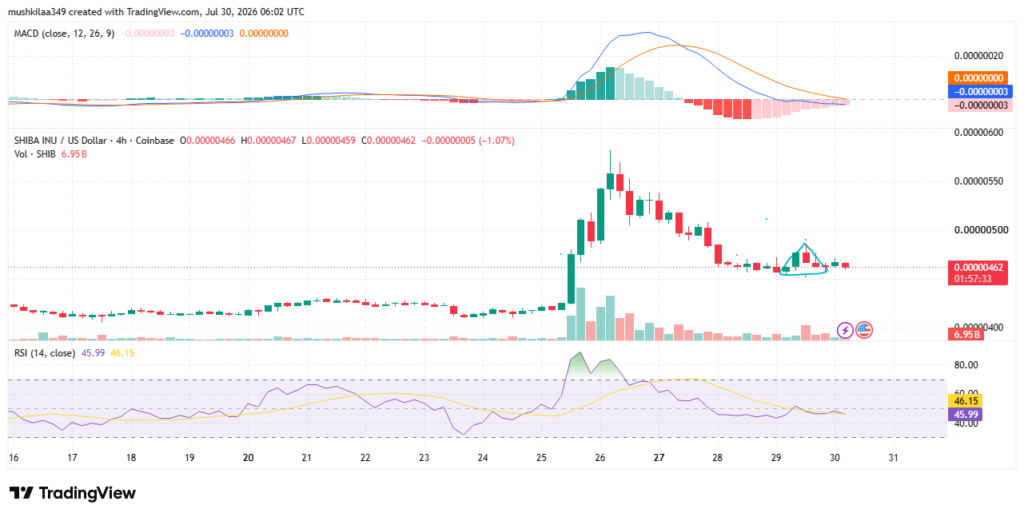
A circular recovery pattern was formed near the trading candle recently. Buyers once pushed the price to US$0.000049, but the momentum later weakened, so the rebound has not yet been completed. Trading volume declined after accelerating the previous breakthrough, reflecting a decrease in participation during the correction. Stronger buying volume will improve breakthrough prospects.
MACD continues to move towards a possible bullish cross, while the RSI remains near the neutral region of 45.6 and below the neutral level of 50. Prices remain above $0.0000046 and the next level of resistance could be $0.000050. If the breakthrough is successful, the previous swing high of US$0.000055 will be exposed; otherwise, the consolidation will continue.






















