
 Exchange Ranking
 Top Exchanges
 24h Volume Ranking
 Popularity Ranking
 Exchange BTC Balance
 Proof of Reserves
 Decentralized Exchanges
 Funding Rate
 Funding Heatmap
 Liquidation Data
 Max Pain
 Long/Short Ratio
 Whale L/S Ratio
 Binance/Okex/Huobi L/S
 Bitfinex Margin L/S
 ETF Tracker
 Solana ETF
 XRP ETF
 Hong Kong ETF
 Bitcoin Treasuries
 Crypto Reversal
 Ethereum Reserves
 HyperLiquid Wallet Analysis
 Hyperliquid Whale Watch
 Large Transactions
 On-chain Movement
 Bitcoin ROI
 Stablecoin Market Cap
 Options Analysis
 News
News Articles
 Economic Calendar
 Features
 Wallet
 Contract Calculator


 Security
 Collections
 Watchlist
 Following
 DOGE
DOGE So where will DOGE go next? Our short-term price forecast for Dogecoin boils down to one question: Can it hold on to current support and turn higher? If buyers enter and break through the resistance above, there will be real room for upside. If, on the contrary, the support falls, the path with least resistance will be downward, at least until a new bottom is formed and buyers get another opportunity.
Live DOGE Price Data
DOGE currently hovers around US$0.06974, down 0.6% intraday, fluctuating between US$0.06968 and US$0.07133. Market value: US$10.834 billion. The fully diluted valuation is approximately US$11.929 billion, the number of DOGE in circulation is 155.334 billion, and the total supply is 171.046 billion. There is no concern about the maximum supply ceiling here. 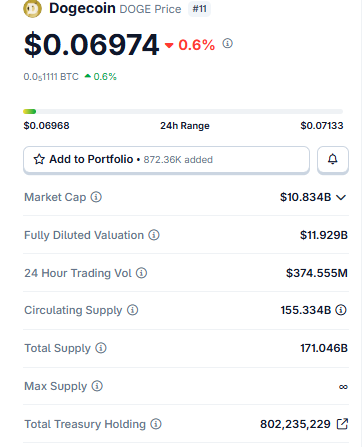
Trading volume in the past 24 hours reached US$374.555 million, which is not surprising, but enough to base this forecast on real trading activity rather than the impact of a few sparse transactions on the candle chart.
It is also worth noting that the treasury holds more than 802 million DOGE units on the chain, a low-key detail that is more important to long-term supply observers than this week's price fluctuations.
Exchange Volume and Liquidation Snapshot
The transaction volume itself explains the problem. Binance leads with US$223.03 million, followed by OKX with US$147.71 million, and Bybit, MEXC, Gate and Bitget form the next echelon. 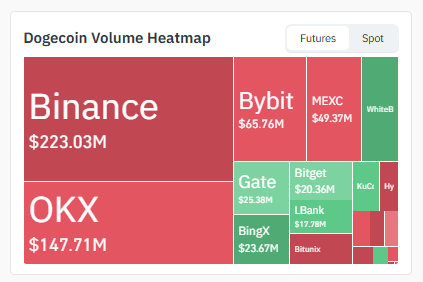
This concentration on a few major exchanges is important: a large order on Binance or OKX may push the candle chart more significantly than elsewhere.
The derivatives market also paints an interesting picture. The total 24-hour liquidation reached US$671.48 million, with short positions suffering a bigger hit at US$517,400, while long positions were only US$154.08 million. 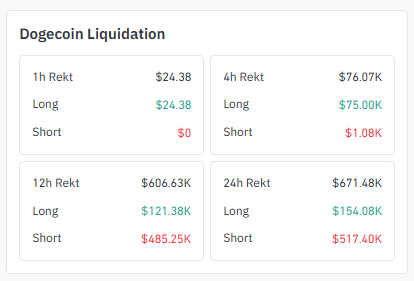
Zoom in to the 12-hour window, the same pattern: short liquidations of US$485.25 million, and long liquidations of US$121.38 million, which indicates that DOGE still has some sharp surges despite the heavy overall trend.
Dogecoin News Today
A trader recently bluntly said: DOGE looks like an asymmetric bet after slowly falling since near a high of 48 cents early last year. His point of view? 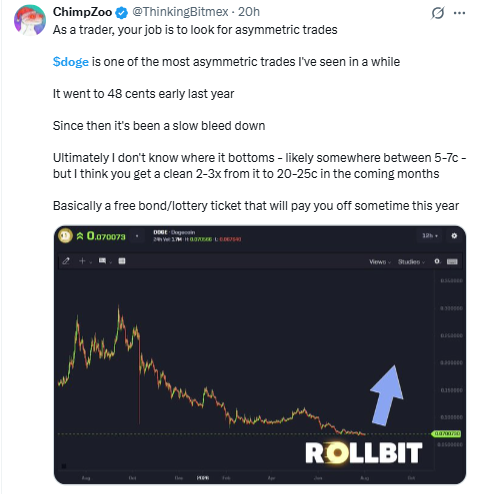
The bottom may be in the middle of the single-digit cents range, and once the bottom is actually confirmed, there will be room for several times higher in the coming months.
Of course, this is a longer-term framework and will not change the trend on the chart this week. But it does explain why traders pay so close attention to these support levels. Everyone is waiting for the same bottom to confirm themselves.
Key Takeaways
DOGE is currently held at around US$0.06974, down 0.6% during the day, almost right at the first support level in the daily downtrend channel.
If it rebounds here and breaks through the upper channel, US$0.07529 comes into view, followed by US$0.07942.
If there is no rebound, the support will be broken? The daily Wolfe Wave structural point fell again to US$0.06426.
On the 4-hour chart, DOGE is tapping the downtrend line near $0.06985. If a large volume breakthrough can be achieved, the door will be opened to US$0.07204 and US$0.07357.
The total liquidation amount in the past 24 hours reached US$671.48 million, with the short position even worse at US$517,400, while the long position was only US$154.08 million.
4H Chart Technical Analysis
Focusing on the 4-hour chart, DOGE is pressing the downtrend line near US$0.06985, having previously rebounded from the lower shadow line in the session. 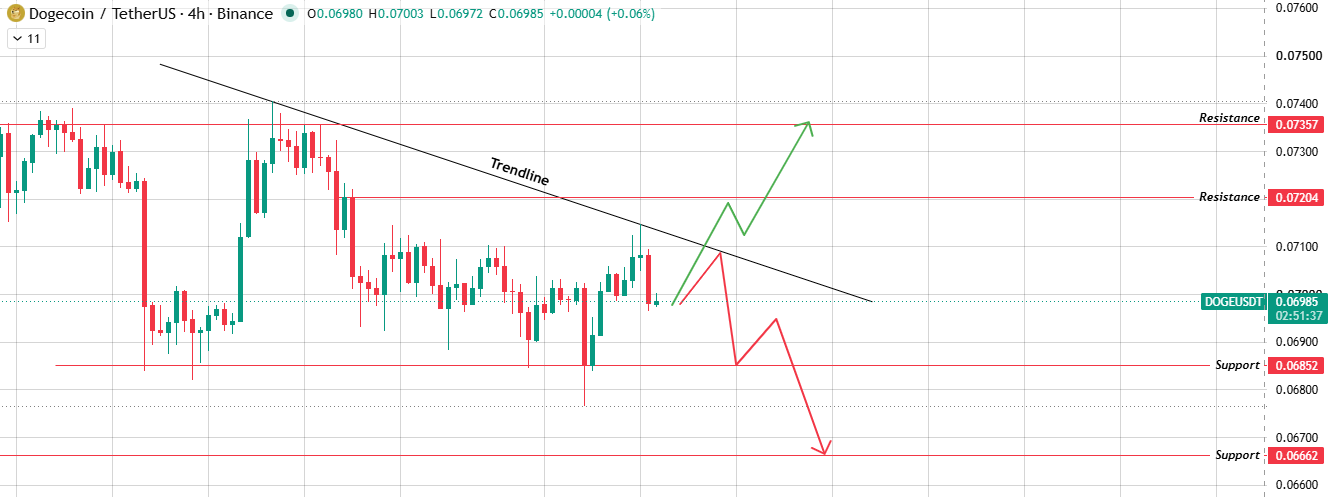
If the trend line can be exceeded in volume, the path opens to US$0.07204, followed by US$0.07357. If it is rejected, it means that the seller is still firmly in control of the situation and may fall back to $0.06852 or even $0.06662.
Daily Chart Technical Analysis
DOGE has been slowly moving downward in the downtrend channel of the daily chart for several weeks. Look carefully and you will find a five-point structure similar to the Wolfe Wave, outlining every wave along the way. 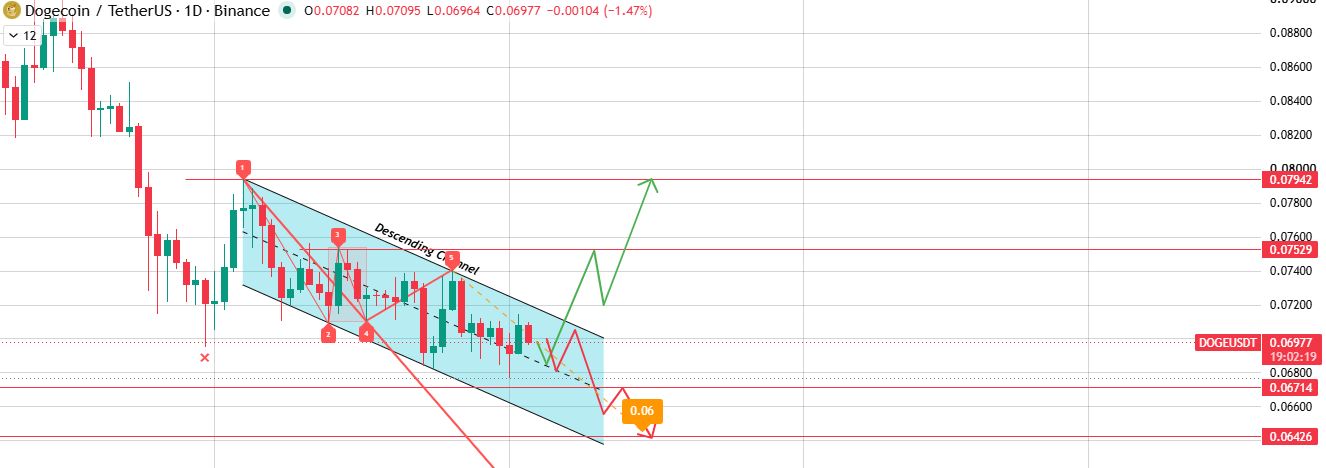
Prices are currently hitting the first support level around US$0.06714, almost right down the channel. There are indeed two roads ahead.
If you rebound from this support and break through the upper channel, the next targets are $0.07529 and $0.07942. But if a rebound fails, and if the support breaks, the Wolfe Wave structure suggests another fall to $0.06426. Sellers will continue to control the situation until the area is tested.
What's interesting? This short-term picture is almost completely consistent with the daily channel. It's actually the same battle, just on a smaller time scale, which is why the two time frames should be read together rather than viewed as separate signals.
Bull vs Bear Scenarios
Bulls need to meet three conditions at the same time: DOGE holds daily support, breaks through the upper track of the downtrend channel, and breaks through the 4-hour trend line with actual trading volume. To do this,$0.07204,$0.07357, and ultimately $0.07529 to $0.07942 will all come into view.
Shorts require the opposite. The trend line rejected prices, the daily support of US$0.06714 fell, DOGE slipped towards US$0.06662 on the 4-hour chart, and the daily chart slid towards US$0.06426.
This dogcoin price forecast puts both scenarios on the table until a decision is made at a confirmed closing price outside the channel, so don't rush into action just because of a shadow line.
Methodology:
This forecast is based on TradingView's technical analysis of 4-hour charts and daily charts, current market data, exchange volume distribution and clearing data. Does not constitute financial advice.
Glossary
Downward channel: Imagine two parallel lines that slope downward, sandwiching the price. This is the channel DOGE has been struggling with.
Wolfe Wave: A five-point swing pattern that traders focus on because it often signals the trend is about to run out.
Trend line: Simply put, it is a line drawn connecting price highs or lows to depict the trend direction and possible breakthrough points.
Liquidation: What happens when a leveraged trade is forced to close because a loss consumes available margin.
Support area: A price area where buyers have appeared here before and pushed prices up, so traders are concerned about whether it will happen again.
Disclaimer:
This content is for information only and should not be regarded as financial advice. The cryptocurrency market (including dogcoin) is volatile and carries a significant risk of loss. Be sure to research and consult a licensed financial adviser before making an investment decision.






















