Exchange Ranking
 Top Exchanges
 24h Volume Ranking
 Popularity Ranking
 Exchange BTC Balance
 Proof of Reserves
 Decentralized Exchanges
 Funding Rate
 Funding Heatmap
 Liquidation Data
 Max Pain
 Long/Short Ratio
 Whale L/S Ratio
 Binance/Okex/Huobi L/S
 Bitfinex Margin L/S
 ETF Tracker
 Solana ETF
 XRP ETF
 Hong Kong ETF
 Bitcoin Treasuries
 Crypto Reversal
 Ethereum Reserves
 HyperLiquid Wallet Analysis
 Hyperliquid Whale Watch
 Large Transactions
 On-chain Movement
 Bitcoin ROI
 Stablecoin Market Cap
 Options Analysis
 News
News Articles
 Economic Calendar
 Features
 Wallet
 Contract Calculator


 Security
 Collections
 Watchlist
 Following
 BTC
BTC  ETH
ETH  PENGU
PENGU  SHIB
SHIB Every Shiba Inu price forecast you have read is actually a market value forecast disguised as a price forecast. Once you convert it to market value, most predictions are no longer predictions, but non-valid arithmetic problems.
The current trading price of SHIB is $0.000055, the total circulation volume is 589.24 trillion tokens, and the market value is approximately US$3.24 billion, ranking 32nd among all cryptocurrencies. This supply figure is the core of the entire analysis. When the price reaches $0.000010 (the last time SHIB appeared at this price was in January 2026), the market value is approximately $5.9 billion. When the price reaches $0.0001-the target that has surfaced repeatedly on social media-the market value will be approximately $58.9 billion, about one-fifth of Ethereum's current $293 billion market value. When the price reaches that eternal $0.01, the market value required for SHIB is US$5.89 trillion: approximately 3.8 times the total market value of Bitcoin and easily exceeds the combined value of all existing cryptocurrencies. It's not impossible, it's arithmetically impracticable.
Therefore, this article is different from the usual meme coin forecast. Rather than picking a number and fabricating a story backwards, it starts with the supply-adjusted market value needed for each price point and asks a key question: Which of these valuations will hold up when compared to other comparable assets? This re-framing yields a narrower and more honest range than the forecasts circulating in the market: a bullish scenario of $0.00010, requiring SHIB to roughly double back to the $5.9 billion market value it did reach eight months ago; a bearish scenario of $0.000035, corresponding to a $2.1 billion valuation, would take it below a 12-month low. Both goals are achievable. Prices above $0.00002 require a valuation of SHIB that exceeds that of mature tier 1 networks with revenue, developers and institutional products-and few people making these predictions are willing to say them directly in such terms.
Key facts:
·The trading price of SHIB is $0.000055, with a market value of US$3.24 billion, ranking 32nd-CoinGecko, August 22, 2026
·The circulating supply is 589.24 trillion tokens, which determines each price target-CoinGecko, August 22, 2026
· SHIB is 61.5% lower than its 12-month high of $0.0001428 and 93.6% lower than the historical high of $0.0008616 in October 2021-CoinGecko, August 22, 2026
·Rebound 33.5% from a 12-month low of $0.0000411--CoinGecko, August 22, 2026
·A price of $0.0001 means a market value of $58.9 billion;$0.01 means $5.89 trillion, which is approximately 3.8 times Bitcoin's market value of $1.55 trillion-calculated based on CoinGecko supply data
·The 24-hour transaction volume is $280.7 million, which is approximately 8.7% of the market value-CoinGecko, August 22, 2026
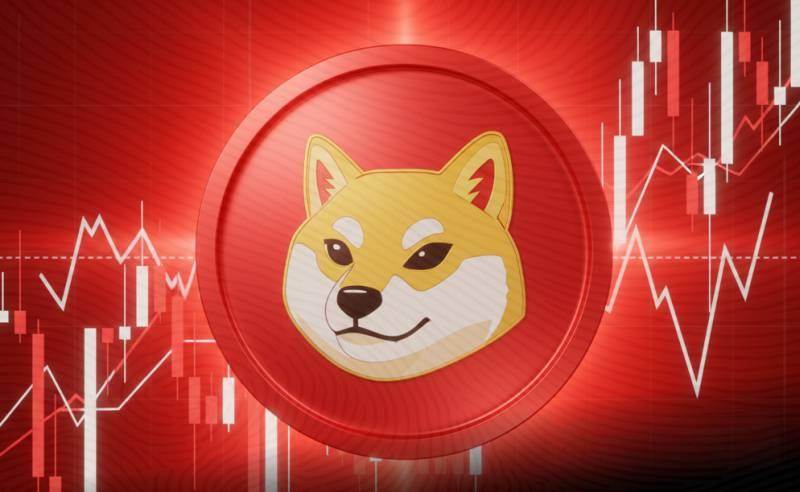
The 12-month trend of SHIB under two scenarios, and the actual market value required for each target price. Source: CoinGecko.
Why supply numbers determine everything
Meme coin predictions are wrong because the human brain sees $0.01 and sees it as "cheap" and sees $77,225 as "expensive". In fact, without supply data, the price of a single token is meaningless. There are approximately 19.9 million bitcoins. There are 589.24 trillion SHIBs-approximately 29.6 million times the number of units of Bitcoin. After conversion, those popular goals become statements about relative valuations.$ 0.00002 means a market value of $11.8 billion, which sounds reasonable;SHIB has reached higher market values in the past two years.$ 0.0001 means $58.9 billion, which will allow SHIB to exceed most first-tier networks that handle real economic activity.$ 0.001 means $589.2 billion-twice the current market value of Ethereum, and it's just an ERC-20 token settled on Ethereum.$ 0.01 This means US$5.89 trillion, which is several times more than the total value of the entire cryptocurrency market.
This is why "destroying narratives" is questionable, and its suspicion is proportional to its popularity. Token destruction does reduce supply, and SHIB's destruction mechanism is also real. But the destruction rate required to change the arithmetic is huge: Reducing the supply by 90%-an extremely extreme result-would still leave 58.9 trillion tokens, which means $0.01 would still require a market value of $589 billion. Destruction can change the situation marginally, but not the order of magnitude that makes popular goals impossible.
Here's a useful cross-market analogy, and it's not in the cryptocurrency space. The stock market solved this confusion decades ago, citing the market value at the same time as the stock price. The reason is precisely that if you don't multiply it by the number of shares outstanding, you don't know their relative size. No one would think that a penny is "cheaper" than Berkshire Hathaway based on its price per share. Cryptocurrencies, unique among all major asset classes, still habitually promote their targets at a price per unit, while the audience has no idea of the number of units-and meme coins have a trillion-dollar unit count, which is caused by this gap. The biggest harm. A reader may immediately reject "This company will surpass Apple" but will gladly share "SHIB to $0.01" because the second sentence conceals that it is actually the first sentence and is multiplied several times.
Therefore, the practical test is simple and worth applying to any meme forecast you encounter: multiply the target price by the circulation supply, and ask yourself if you would defend that valuation against a specific comparable asset. If the answer is a company or network you have heard of, and the meme coin is obviously doing less, then the goal is not a prediction. For SHIB, the threshold at which this test starts to fail is between $0.0002 and $0.0001-that is, between $11.8 billion (with historical precedent) and $58.9 billion (with no precedent).
None of the above means that SHIB cannot rise. Instead, the achievable range is much lower and narrower than what is advertised in the market; a target above $0.0001 actually means that SHIB's valuation will exceed Ethereum, not that a meme coin will rebound.
What actually happened to the SHIB this year
SHIB is 61.5% below its 12-month high of $0.00001428 and 93.6% below its historical high in October 2021. It fell to a low of $0.0000411 and rebounded 33.5% from there, this time more like following the rally of the entire cryptocurrency market than a factor unique to SHIB-.
This last point is worth keeping in mind. Shiba Inu has increased or evaporated billions of dollars in market value many times, but the fundamentals have not changed accordingly-we once recorded such an incident in an article: "Shiba Inu's market value increased by $1 billion without obvious catalysts." Meme coins are pure liquidity tools: when risk appetite rises, they absorb speculative funds; when risk appetite declines, they release funds faster than any other asset. The beta coefficient of SHIB is the product itself, not the defect.
The current rebound fits this pattern perfectly. SHIB rose along with the broader market in August, as described in the article "$2.55 trillion cryptocurrency market turns bullish: SHIB and PENGU surge." It has risen not because of product launches, partnerships or changes in token economics, but because Bitcoin has risen and speculative capital flows down the risk curve-and when this flow stops, the reverse process will be exactly the same.
Liquidity is the only truly encouraging indicator. The daily trading volume is US$280.7 million, corresponding to a market value of US$3.24 billion. SHIB changes hands about 8.7% of its value every day. For its size, this is deep liquidity, meaning that large positions can be moved in and out without catastrophic slippage-an important difference between SHIB and thousands of meme tokens that cannot claim the same advantage.
Honest evaluation of the two scenarios
Presenting them in terms of market value rather than price, the scenarios become assessable:
price| implied market value| Change from $0.000055| Conditions required
$0.000035 (Bear)|$2.1 billion| -36.4% |Hit a 12-month low; crypto currency widely hedged
$0.000055 (current price)|$3.2 billion| - |Current status
$0.00010 (Bullish)|$5.9 billion| +81.8% |Return to January 2026 valuation
$0.0002| $11.8 billion| +263.6% |Above 12-month high; full speculative cycle
$0.0001| $58.9 billion| +1,718% |More than most functioning Layer 1 networks
$0.001| US$589.2 billion| +18,082% |It is twice the market value of Ethereum, and it is just a token running on Ethereum
$0.01| $5.89 trillion| +181,718% |It is 3.8 times the market value of Bitcoin; a bullish scenario of $0.000010 that exceeds the sum of all cryptocurrencies
is the highest level that can easily pass this test. It requires SHIB to return to the $5.9 billion market value it reached in January 2026-a true, recent, proven valuation, not an assumption. This was a reasonable result given the strong cryptocurrency market and meme led the gains, and a 33.5% rebound from the low point suggests that funds do flow in when conditions permit.
A bearish scenario of $0.000035 requires SHIB to hit a 12-month low at a market value of $2.1 billion. Considering that it reached $0.00000411 in the past year, and meme led the decline, this scenario requires no special explanation-a widespread risk aversion can be achieved mechanically. Note the asymmetry of the conditions required for these two scenarios: bullish scenarios require a favorable environment coupled with speculative funds specifically diverted to meme coins, while bearish scenarios only require the former condition to fail.
We published a Shiba Inu bullish/bearish article on July 27, 2026:"Shiba Inu SHIB Price Forecast: $0.000065 Bullish Scenario vs $0.0000041 Bearish Scenario", when the trading price of SHIB was lower than it is now. Both levels are still near current prices, but the range has narrowed to almost uninformative: the bearish scenario there is now basically a 12-month low, while the bullish scenario is only 18%. This is an inherent risk in any call/bear pairing-the numbers are derived against a current price, and once the current price changes, the title becomes stale, regardless of whether the analysis itself is reasonable or not. Please look at the numbers in this article in the same way.
Structural risks specific to Meme assets
Regulatory discussions around digital assets have clearly turned to classification issues: what are securities, what are commodities, and what are payment instruments. Meme coins are in an awkward position in this framework because they do not make any formal claims of utility, which instead protects them-an asset that promises nothing and is difficult to be prosecuted for failing to deliver.
Risk lies at the distribution level, not at the asset level. Exchange listing standards-not securities laws-are the actual threshold for tokens like SHIB, and these standards are set by exchanges based on the regulatory pressures they face. Changes in listing policies on major exchanges will have an impact on SHIB prices much faster than any legislative change. Moreover, unlike Bitcoin or Ethereum, SHIB has no ETF packaging, no corporate treasury holders, and no institutional custody base to cushion shocks.
There is a second, more subtle structural issue. SHIB's destruction narrative relies on continued community participation, which in turn relies on price. When prices fall, destruction activity decreases, which weakens the narrative, which in turn weakens prices further. Bitcoin's security budget and Ethereum's fee destruction are mechanical and run regardless of whether people are enthusiastic or not. The destruction of SHIB is reflective. This reflexivity is why meme has fallen more deeply and its recovery requires a real change in overall market risk appetite rather than a company-specific catalyst.
What happens next: Three inference-based predictions
First, the direction of SHIB is determined by Bitcoin, not by SHIB itself. There has been no indication in the past 12 months that SHIB will fluctuate independently based on its own information. It is a leveraged expression of cryptocurrency risk appetite, so the actual forecast is conditional: if Bitcoin climbs towards the US$80,000 to US$85,000 range considered most likely by the market, SHIB may reach the US$0.000070 to US$0.000080 range. If Bitcoin fails and falls back, SHIB will test the lows first and most violently.
Second,$0.00010 can be achieved during this cycle, but $0.0001 cannot be achieved. The former requires a market value of US$5.9 billion that SHIB has reached this year. The latter would require $589 billion, which would make a meme token worth more than most networks with practical uses. The difference is not emotion, but supply-adjusted arithmetic; no reasonable destruction rate can bridge such a huge gap in a single cycle.
Third, it is expected that the $0.01 target will continue to circulate. It requires a market cap of $5.89 trillion-3.8 times the size of Bitcoin-but it will still be the most shared Shiba Inu forecast on social media because price per unit is intuitive and market cap arithmetic is not intuitive. Anyone who quotes this goal without also stating the implied valuation either did not do the conversion himself or hoped that the reader would not do the conversion.
The reasonable range for SHIB is roughly between $0.000035 and $0.00010, corresponding to a market value of $2.1 billion to $5.9 billion. This is a very wide range and an honest range. It's also much narrower than the most-watched forecasts-which usually happens when you convert a price target into the valuation it actually implies.
Frequently Asked Questions
Q: What is the reasonable price forecast for Shiba Inu in 2026?
Answer: The reasonable range is $0.000035 to $0.00010, corresponding to a market value of US$2.1 billion to US$5.9 billion. The upper limit requires SHIB to return to the valuation it reached in January 2026; the lower limit requires it to hit a moderate 12-month low.
Q: Can Shiba Inu coins reach $0.01?
Answer: Not possible with current supply. There are 589.24 trillion tokens in circulation, and $0.01 means a market value of US$5.89 trillion-approximately 3.8 times the entire US$1.55 trillion market value of Bitcoin and more than the entire cryptocurrency market combined. Even if 90% of the supply was destroyed, a market value of US$589 billion would still be needed at this price.
Q: Will token destruction significantly push up the SHIB price?
Answer: Destruction helps marginally, but does not change orders of magnitude. Removing 90% of the supply would still leave 58.9 trillion tokens, so $0.0001 would still require a market cap of $5.9 billion and $0.01 would still require $589 billion. The actual destruction rate is only a fraction of that.
Q: Why did SHIB fall deeper than Bitcoin?
Answer: SHIB is 61.5% lower than its 12-month high, while Bitcoin is 38% lower. Meme coins are the expression with the highest beta coefficient among cryptocurrency risk appetite. There are no ETF inflows, no corporate treasury buyers, and no institutional custody base to alleviate selling pressure during declines.
Question: Is the trading volume of Shiba Inu coins healthy?
Answer: In terms of relative proportion, yes. The daily trading volume of US$280.7 million, corresponding to a market value of US$3.24 billion, means that about 8.7% of assets change hands every day, which is deep liquidity for its volume, which also distinguishes SHIB from most meme tokens.
Question: Which single factor should I focus on to judge the direction of SHIB?
Answer: Bitcoin. Over the past year, the SHIB has shown little ability to fluctuate independently based on its own information, so the realistic approach is conditional: When Bitcoin rises and speculative capital rotates outward, the SHIB rises; when this rotation reverses, it falls first and most violently.
Q: How can I verify the price target of any meme coin by myself?
Answer: Multiply the target price by the circulating supply to get the implied market value, and then compare it with assets you are familiar with. If the result exceeds the valuation of a major network, and the token does essentially less, then the goal is not arithmetic, rather than a valid prediction worthy of action.
This article is for analysis and information only and does not constitute investment advice, nor does it constitute a recommendation to buy or sell any assets. Market value data is calculated based on circulating supply and may change due to changes in supply. The quoted data is accurate on August 22, 2026.