Exchange Ranking
 Top Exchanges
 24h Volume Ranking
 Popularity Ranking
 Exchange BTC Balance
 Proof of Reserves
 Decentralized Exchanges
 Funding Rate
 Funding Heatmap
 Liquidation Data
 Max Pain
 Long/Short Ratio
 Whale L/S Ratio
 Binance/Okex/Huobi L/S
 Bitfinex Margin L/S
 ETF Tracker
 Solana ETF
 XRP ETF
 Hong Kong ETF
 Bitcoin Treasuries
 Crypto Reversal
 Ethereum Reserves
 HyperLiquid Wallet Analysis
 Hyperliquid Whale Watch
 Large Transactions
 On-chain Movement
 Bitcoin ROI
 Stablecoin Market Cap
 Options Analysis
 News
News Articles
 Economic Calendar
 Features
 Wallet
 Contract Calculator


 Security
 Collections
 Watchlist
 Following
 BTC
BTC  PEPE
PEPE PEPE price forecast: Long-term bullish and short-term technical analysis
PEPE has been in a tightening shock range in the past few days, and this is the core of this PEPE price forecast. PEPE made its debut in 2023 as a meme token based on the well-known Internet frog image, and has since maintained its status as one of the most actively traded projects in the field.
Currently, the price of PEPE today is $0.0000367, an increase of 1.9% within the day. The market value has climbed to $1.547 billion, with transaction volume in the past 24 hours reaching $233,962 million.
PEPE Real-time Market Data
Indicator Value Price $0.00000367 Market Value $1.547B Fully Diluted Valuation $1.547B 24-Hour Trading Volume $233.962M Circulation supply 420.69T Total supply 420.69T Maximum supply 420.69T Source: PEPE market data from CoinGecko, as of September 9, 2026. Data from other tracking sites may differ slightly.
Liquidation Snapshot
Time frame Total Liquidation Amount Long Short 1 hour $3.84K $3.41K $429.5 4 hours $36.57K $3.41K $33.16K 12 hours $282.91K $130.57K $152.33K 24 hours $513.11K $320.37K $192.74K Source: Liquidation data from CoinGlass, as of September 9, 2026.
There are no extreme imbalances here compared to some recent settings, although long positions have slightly higher liquidations than short positions in most time windows. It is worth paying attention again to the 4-hour data; there, bears suffered greater losses, consistent with $PEPE pushing back up the upper boundary of the triangle and catching some sellers off guard.
Exchange volume
OKX currently faces few challenges in $PEPE futures, with daily trading volume of $119.63 million. MEXC followed closely with $73.61 million. 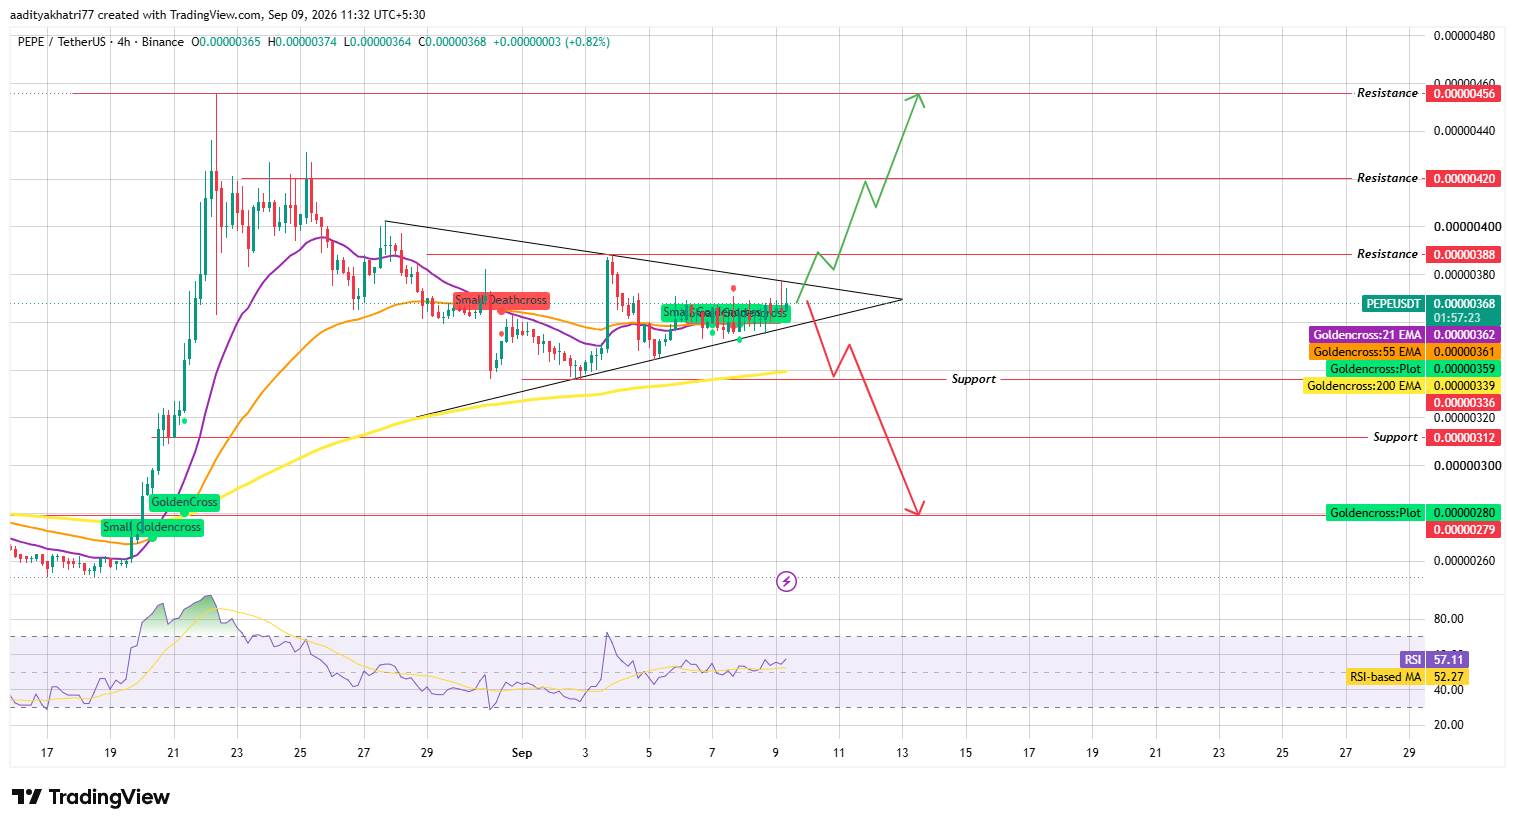 LBank and Bitget handled volumes of $33.68 million and $31.93 million respectively, while KuCoin, Gate and Bitunix each had volumes ranging from $15 million to $17 million. Coinbase and CoinEx ended the list with smaller contributions.
Today's PEPE News: Traders Focus on
Long-term bullish interpretation of PEPE
A trader named KNIGHT pointed out the strong upside potential of $PEPE this week, sharing a long-term chart that maps a lower accumulation area to a higher target area above current prices. This is a macro, multi-month view rather than a judgment of $PEPE's direction in the next few days, so it is best to view it as a trader's view of the big picture rather than a signal related to the current triangle shape.
2026 PEPE Price Forecast: Technology Outlook
Open the 4-hour PEPE/USDT chart on Binance and the settings are easy to see: Since late August, prices have been compressed within an asymmetric triangle, with a downward trend line pressing from above and an upward trend line pushing from below. This squeeze has pulled $PEPE towards the vertices of the triangle, and vertices like this rarely remain silent for long periods of time.
Several small EMA intersections also appeared en route, with the 21 and 55 EMA currently almost overlapping around $0.000036, which roughly sums up the hesitation of the past two weeks. The RSI is at 57.11, above its moving average of 52.27, which is slightly bullish but far from overheating.
$Can PEPE break through higher resistance levels?
If the downtrend line breaks with a strong 4-hour close with volume, then $0.0000388 will be the first stop. Once this obstacle is cleared,$0.0000420 will be open, and if momentum continues,$0.0000456 will be the next target.
What happens if $PEPE falls below the uptrend line?
Now reverse it. If prices turn below the uptrend line and volume confirms this movement, then $0.0000336 should be the first level to be touched. Slide through this and $0.0000312 comes into view, which will mark the real collapse of this multi-week squeeze.
Support and Resistance Levels
Support resistance $0.0000336 $0.0000388 $0.000312$0.0000420 $0.0000279$0.0000456 EMA level (4 hours)
EMA level 21 EMA $0.0000362 55 EMA $0.0000361 200 EMA $0.00000339 bull market, Benchmark and Bear Market Scenarios
Scenarios Set Level Bull Market Accompanied by Volume Breaking Through the Downtrend Line.$ 0.00000388-$0.0000456 Baseline price is integrated near the apex of the triangle.$ 0.0000036-$0.000038 Bear market accompanied volume falling below the uptrend line.$ 0.0000336-$0.0000279 Glossary
Asymmetric Triangle: Two convergence lines, one sloping downward and one sloping upward, squeeze prices tighter and tighter-this is the essence of the asymmetric triangle, and its final breakthrough usually becomes more impactful as the squeeze time goes on.
Gold Cross: This occurs when the short-term EMA climbs beyond the long-term EMA and is usually considered a bullish signal, while a death cross is the opposite, where the short-term EMA slips below the long-term EMA.
RSI (Relative Strength Index): is more about speed than direction; it records the speed and magnitude of recent price movements, which makes it very useful in identifying whether momentum still has potential.
Support and Resistance: In the final analysis, these are just areas where buyers or sellers have frequently appeared enough to stop or reverse movement.
PEPE and Bitcoin
Meme tokens have a habit of exaggerating the emotions set by Bitcoin, and PEPE closely fits this pattern, which is why Bitcoin's price today remains so important to the development of this triangle. Even if bitcoin price forecast sentiment shifts slightly, PEPE's thin liquidity tends to translate this shift into larger and faster movements than large-cap coins.
Expert opinion
Traders observing the $PEPE settings point out that symmetrical triangles so close to the apex tend to not stand still; the range becomes too narrow to maintain long-term hesitation. The short squeeze visible in the 4-hour liquidation numbers gave a slight boost to bullish cases, although most believe the actual direction of the breakthrough may depend more on broader market conditions than on any factor specific to PEPE-related.
Disclaimer
This PEPE price forecast is for informational purposes only and should not be considered financial advice. The cryptocurrency market is highly volatile and technical forms may not develop as expected. Any of the above scenarios may not occur. Readers should conduct independent research before making any investment decisions.