Exchange Ranking
 Top Exchanges
 24h Volume Ranking
 Popularity Ranking
 Exchange BTC Balance
 Proof of Reserves
 Decentralized Exchanges
 Funding Rate
 Funding Heatmap
 Liquidation Data
 Max Pain
 Long/Short Ratio
 Whale L/S Ratio
 Binance/Okex/Huobi L/S
 Bitfinex Margin L/S
 ETF Tracker
 Solana ETF
 XRP ETF
 Hong Kong ETF
 Bitcoin Treasuries
 Crypto Reversal
 Ethereum Reserves
 HyperLiquid Wallet Analysis
 Hyperliquid Whale Watch
 Large Transactions
 On-chain Movement
 Bitcoin ROI
 Stablecoin Market Cap
 Options Analysis
 News
 Articles
 Economic Calendar
 Features
 Wallet
 Contract Calculator


 Security
 Collections
 Watchlist
 Following
 PENGU
 PEPE
PENGU 从 Crypto Patel 的入场区域上涨约 90%,现正测试下行的高时间框架阻力线
Crypto Patel 指出,$0.015、$0.028、$0.043 和 $0.060 是关键目标价位,而 $0.0055 则是该交易结构的失效位。RSI 指标仍高于 50,但动能减弱的 MACD 指标使得 $0.0100 的支撑位和 $0.0110-$0.0112 的阻力位成为关注焦点。
PENGU 在从 Crypto Patel 的入场区域上涨约 90% 后,目前在 $0.01117 附近交易。该代币正在测试一条下行的高时间框架阻力线,而 Patel 列出的目标价位分别为 $0.015、$0.028、$0.043 和 $0.060。Ali Charts 也将 PENGU 的结构与 PEPE 早期的扩张、回调、盘整及后续反弹进行了对比。
PENGU 测试主要高时间框架阻力
Crypto Patel 表示,PENGU 已触及下行的较高时间框架阻力线。他指出,若出现清晰的突破、确认并回测,则可能确认趋势线的突破。此前,PENGU 在 $0.0055 附近获得支撑,而 Patel 将 $0.0090 确认为突破位。
目前,该代币价格仍比其 $0.047-$0.048 的宏观高点低约 77%。Patel 列出 $0.015、$0.028、$0.043 和 $0.060 为主要上行目标。他表示,$0.060 意味着从其入场区域上涨约 10 倍。
然而,Patel 表示,如果持续跌破 $0.0055 的支撑位,则该交易结构将失效。他还强调,他希望看到确认信号,而不是盲目追逐价格波动。
Ali Charts compares PENGU with PEPE
Ali Charts points out that the current structure of PENGU is similar to PEPE's early expansion model. The comparison covered explosive attention, pullbacks from highs, months of consolidation and subsequent liquidity-driven rebound.
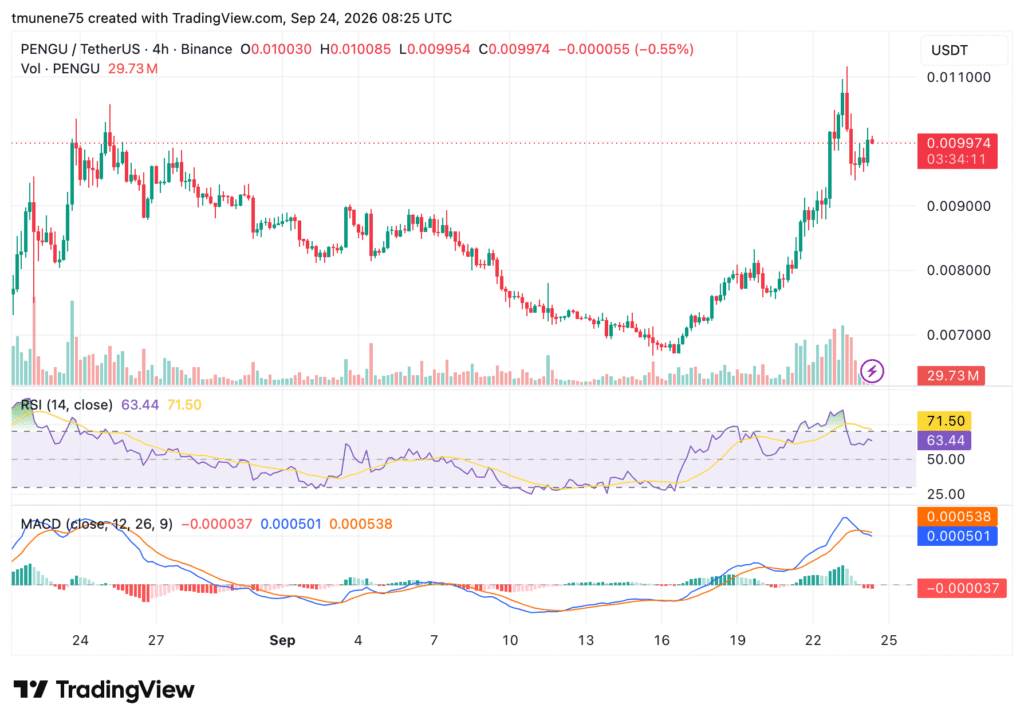
Source:TradingView
According to Ali Charts 'analysis, PENGU may now enter the cycle stage where PEPE begins its largest expansion. He regards PEPE as a representative of Ethereum memecoin, while PENGU may be the counterpart in the Solana ecosystem.
Meanwhile, the 4-hour chart shows that PENGU has begun to recover from a low near $0.0068-$0.0070 in September. Prices formed higher highs and higher lows before breaking through $0.0090 and hitting the $0.0110 area.
PENGU kinetic energy cools near $0.0112
PENGU is currently trading around $0.009974 on the chart, with the latest candle line touching $0.010085. Trading volume was 29.73 million PENGUs, and there were signs of refusing to increase in the $0.0110-$0.0112 region. The RSI read at 63.44, below its moving average of 71.50.
Although the RSI is still above 50, a pullback from above 70 shows weakening momentum. The MACD line is located at 0.000501, which is lower than the signal line of 0.000538. Its histogram reading is-0.00037, indicating that bearish momentum has begun to appear.
$0.0100 remains the key psychological barrier for price levels. Holding this position may allow $0.0110-$0.0112 to be tested again; failure to comply will expose $0.0090 and $0.0080.