
 Exchange Ranking
 Top Exchanges
 24h Volume Ranking
 Popularity Ranking
 Exchange BTC Balance
 Proof of Reserves
 Decentralized Exchanges
 Funding Rate
 Funding Heatmap
 Liquidation Data
 Max Pain
 Long/Short Ratio
 Whale L/S Ratio
 Binance/Okex/Huobi L/S
 Bitfinex Margin L/S
 ETF Tracker
 Solana ETF
 XRP ETF
 Hong Kong ETF
 Bitcoin Treasuries
 Crypto Reversal
 Ethereum Reserves
 HyperLiquid Wallet Analysis
 Hyperliquid Whale Watch
 Large Transactions
 On-chain Movement
 Bitcoin ROI
 Stablecoin Market Cap
 Options Analysis
 News
News Articles
 Economic Calendar
 Features
 Wallet
 Contract Calculator


 Security
 Collections
 Watchlist
 Following
 DOGE
DOGE Dogecoin Price Forecast
This article's Dogecoin price forecast focuses on DOGE's current trading price of approximately US$0.07234. Dog Coin was introduced in 2013 as a joke coin based on Shiba Inu emojis, but has since developed into one of the largest and most actively traded meme coins on the market. Its large fluctuations are mainly driven by market sentiment, community activities and the broader cryptocurrency market trends, rather than any underlying product. This emotion-driven feature is currently emerging, and $DOGE is at a critical juncture, and the next move may be up or down. The rest of this article will provide a detailed analysis of the conditions required for each scenario, as well as which party is currently at greater risk as revealed by volume and liquidation data. This is not a buy and sell signal, but a clear map of key price points.
What does the Dogecoin clearing data show?
According to CoinGlass's Dogecoin clearing data, there is an unbalanced picture: long positions accounted for approximately 84% of the total clearing in the past 24 hours. This tilt has two important meanings.
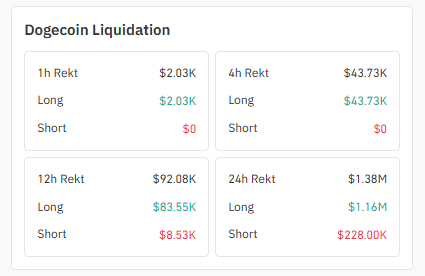 Time Frame Total Clearing Amount Long Clearing Short Clearing 1 hour $2.03K $2.03K $0 4 hours $43.73K $43.73K $0 12 hours $92.08K $83.55K $8.53K 24 hours $1.38M $1.16M $228.00K
First, this means that the recent rally over the four-hour period has repeatedly trapped leveraged buyers rather than leveraged sellers, consistent with signs that the market has not yet bottomed out. Secondly, in a market with such a heavy liquidation of bulls, if the short positions are squeezed, it may still trigger a sharp short covering rebound. Therefore, the data is cautious about the long positions, but does not rule out the possibility of a rapid surge. This is a short-term positioning signal rather than a directional guarantee, and may reverse within hours as new leverage enters the market.
Volume distribution: Where liquidity lies
According to Coinglass's exchange volume data, the trading volume of Dogcoin futures is concentrated on two platforms: Binance (US$197.83 million) and OKX (US$133.03 million), which together account for the vast majority of tracking futures trading volume. 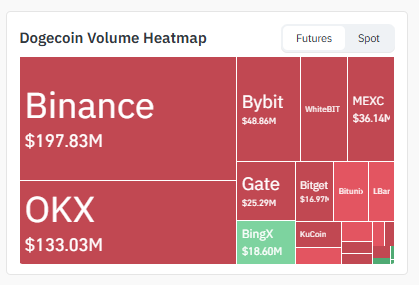 Bybit (US$48.86 million), Gate (US$25.29 million), MEXC (US$36.14 million) and BingX (US$18.6 million) make up the rest, while WhiteBIT, Bitget, Bitunix and smaller platforms have thin trading volumes. Practical significance: Since Binance and OKX dominate trading volume, their order books are most likely to be the birthplace of real breakthroughs or breaks, and their liquidity areas are also the most worthy of attention to confirm trends, rather than those that may amplify trends due to lack of depth. Smaller platforms.
4-hour chart: $DOGE Textbook-style horizontal consolidation
The 4-hour chart shows that DOGE has been limited between US$0.07093 (support) and US$0.07571 (resistance) in the past ten or so trading sessions, and prices have fluctuated within this range without a decisive close from either side. 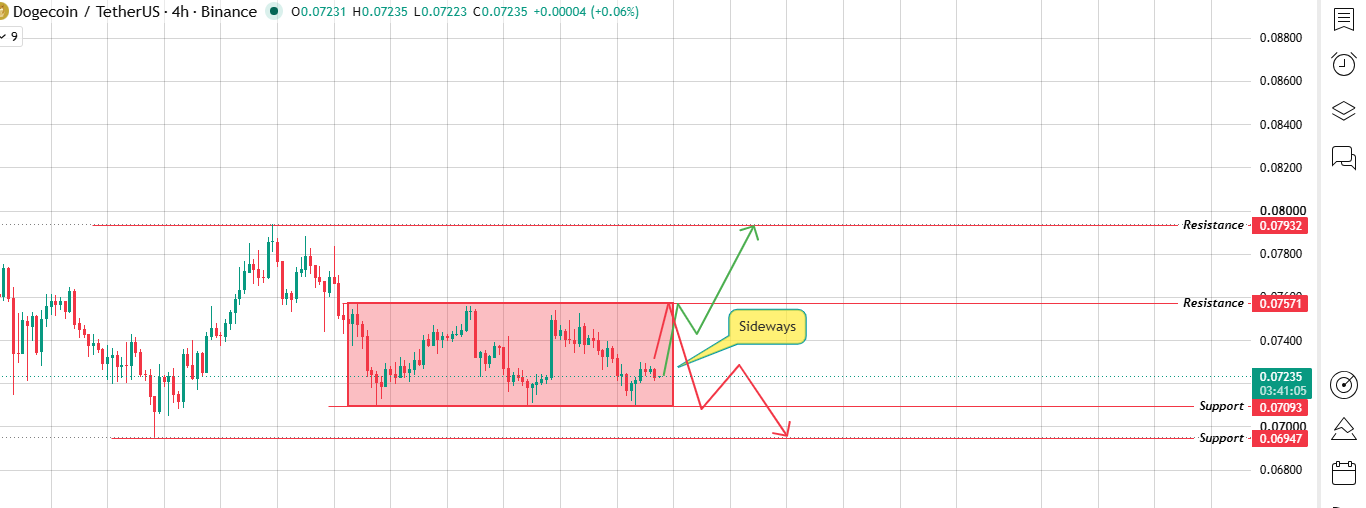
This tight and sustained consolidation usually bodes well for a larger trend because it reflects both parties accumulating positions rather than one party controlling prices. If US$0.07571 is breached and the 4-hour close is above that level, the next resistance level is US$0.07932. A closing price break above that level would be the first real signal that buyers have regained short-term control. If $0.07093 is broken below and the 4-hour close is below that level, the price could test $0.06947, just below the psychological level of $0.07000, an area that has previously shown weakness. Before such a close occurs, the 4-hour trend is by definition neutral, and treating either side of the range as a signal before confirming the close is the reason for losses in most range-swinging trades.
Daily chart: Dogecoin is still below the downtrend line
On the daily time frame, DOGE continues to hit lower highs since the high of US$0.09244. Each rebound is suppressed by the same downtrend line. This trend line currently intersects above the spot price of US$0.07234, which is why the currency price is consolidating below it. 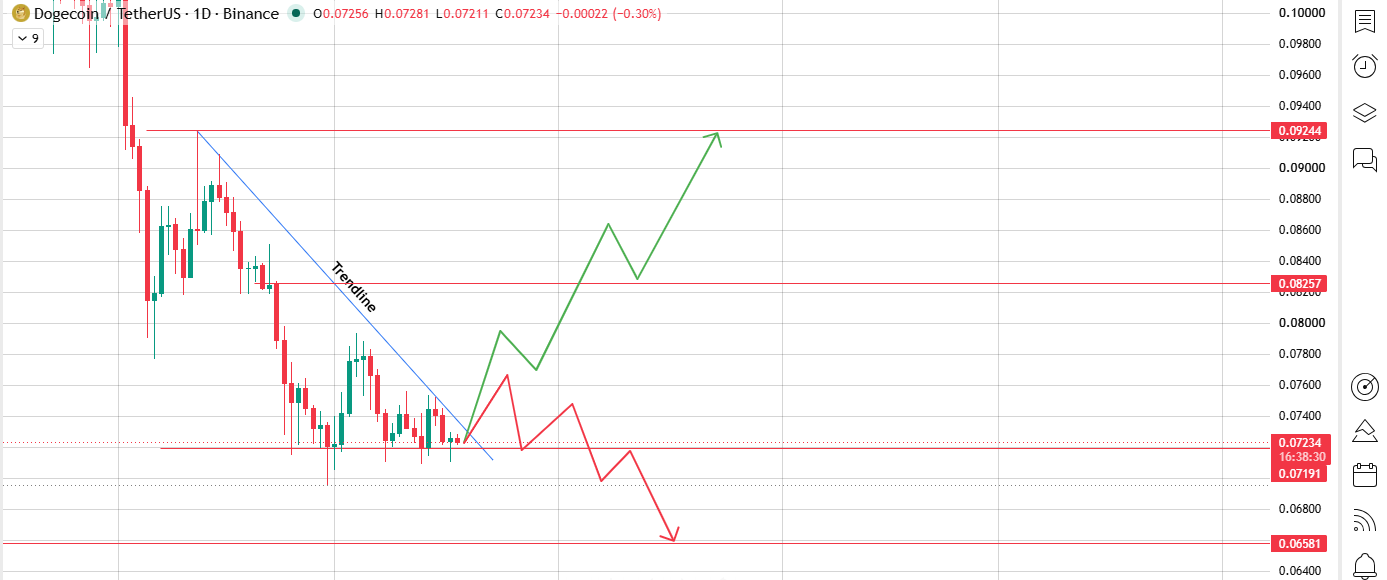
Bullish scenario: The daily closing price breaks through the trend line. The confirmed daily closing price breaking through the trend line will first open the path to US$0.08257, which coincides with the previous consolidation platform and may face certain resistance. If it breaks through US$0.08257 cleanly while continuing to increase volume, the swing high of US$0.09244 will come back into view. Historically,$DOGE's recovery from a similar downward-channel pattern has followed a step-like pattern: it first pushes up, then pulls back slightly, and then pushes up again rather than straight up, so the correction after the first rise should not be automatically interpreted as a breakthrough failure.
Bear scenario: The trend line remains valid or the breakthrough fails. If the price fails to close above the trend line or fails after a brief break, the next support level is $0.07191, which is close to the current price with limited buffer space. Below this,$0.06581 is the more important support level, which previously served as a demand area. A daily close below $0.06581 would negate short-term bullish prospects and open up room for hitting lower levels that have not yet been tested for this round.
Key price list
Level type price range
4-hour resistance 0.07571 US$0.07932 US $
4-hour support 0.07093 US$0.06947
Daily break through target of US$0.08257 → US$0.09244
Daily break below target of US$0.07191 → US$0.06581
Comparison of Dogecoin and other large-cap Meme coins
Compared with other major meme coins, DOGE's current pattern-a decline channel that lasts for several weeks and a tight 4-hour interval-is a fairly standard post-decline consolidation pattern that is not unique to Dogecoin. What is special about this case is the liquidation bias: the 84% long liquidation ratio within 24 hours is at a high level for a currency that has not hit a new low, indicating that leveraged buyers have repeatedly entered early, rather than aggressively shorting the overall market. Traders comparing the DOGE pattern with other meme coins should consider both position data and chart structure rather than just looking at the chart.
Dogecoin rebound observation: Will Dogecoin rebound? When can I reach $1?
Two questions about DOGE arise repeatedly and deserve direct answers.
Will dogcoin recover? In the short term, this depends entirely on the price points covered above. A closing price above US$0.07571, and then above US$0.08257, will be a real bullish breakthrough signal for Dogecoin on this chart. As for whether this will turn into a sustained dogcoin rally rather than a temporary rebound, it depends on whether trading volume on Binance and OKX follows up, and whether long liquidation pressure eases.
When will dog coins reach 1 dollar? Based on the current circulation supply of approximately 150 billion pieces, a price of 1 dollar will bring the market value of Dogecoin to more than 150 billion dollars, exceeding most large technology stocks and far higher than DOGE's current market value of billions of dollars. This is not impossible over a long enough time frame, but it requires massive new demand, adoptions, or supply-side changes that are not yet visible in current charts, volume or ETF flow data. Nothing in this short-term analysis points to this result, and any specific timetable for $1 should be regarded as speculation rather than a forecast.
Bear risks outside the chart
There are two risks that are independent of purely technical aspects and may cover the above price levels: Bitcoin dominance: If Bitcoin's dominance continues to rise, funds will usually flow out of lower-market-value altcoins such as DOGE first, which may put pressure on the US$0.07093 support level independently of specific DOGE news. Leverage reset: The current long liquidation bias means that further declines may quickly clear weak long positions, creating a more severe lower shadow line than simply suggested by chart structure, and a possible rebound later. Neither of these is the basic assumption of this article, but is the condition that most likely negates a bullish interpretation above the trend line.
Methodology: How these prices are constructed
The following prices are derived from three independent chart interpretations rather than a single indicator:
Daily (1D) trend line structure: A downtrend line connecting the high of US$0.09244 to the recent low high, plotted on the Binance DOGE/USDT chart. 4-hour (4H) range mapping: Horizontal support and resistance based on consolidation over the past 10 trading sessions are also plotted on the Binance DOGE/USDT chart. Derivatives positions: Total long/short liquidations from CoinGlass for 1-hour, 4-hour, 12-hour and 24-hour times, used to determine which party's current trading is more vulnerable. In this analysis, only when the candle chart of the relevant time frame confirms that the closing price has exceeded a certain price level, it is regarded as a "breakthrough" rather than an intraday shadow. For example, a single hatching crossing $0.07093 or $0.07571 does not in itself confirm a break or breakthrough.
Disclaimer : This document is for informational and educational purposes only and does not constitute financial advice. The cryptocurrency market is extremely volatile. Before making any trading or investment decisions, study and consult with a licensed financial adviser.






















