
 Exchange Ranking
 Top Exchanges
 24h Volume Ranking
 Popularity Ranking
 Exchange BTC Balance
 Proof of Reserves
 Decentralized Exchanges
 Funding Rate
 Funding Heatmap
 Liquidation Data
 Max Pain
 Long/Short Ratio
 Whale L/S Ratio
 Binance/Okex/Huobi L/S
 Bitfinex Margin L/S
 ETF Tracker
 Solana ETF
 XRP ETF
 Hong Kong ETF
 Bitcoin Treasuries
 Crypto Reversal
 Ethereum Reserves
 HyperLiquid Wallet Analysis
 Hyperliquid Whale Watch
 Large Transactions
 On-chain Movement
 Bitcoin ROI
 Stablecoin Market Cap
 Options Analysis
 News
News Articles
 Economic Calendar
 Features
 Wallet
 Contract Calculator


 Security
 Collections
 Watchlist
 Following
 DOGE
DOGE TLDR
Contents
Dogecoin hits key bottom of the historical cycle
Daily indicators show limited rebound
Dogecoin retested a decade-long uptrend line around US$0.07. This trend line supported major price rallies after testing in 2017 and 2020. DOGE was trading at around $0.0731 and remained above the Bollinger Band support level of $0.0701. The MACD indicator shows an improvement in bullish momentum, but both lines remain below the zero axis. A breakthrough of $0.0777 could strengthen the rebound and open up room for a move towards $0.08.
In July 2026, DOGE returned to a decade-long upward supporting trend line, reigniting market interest in its historical price structure. The memin traded at about $0.073, and buyers defended in an area that had supported previous market rallies. Technical indicators showed improved momentum, but prices remained below the level needed to confirm a stronger rebound.
Dogecoin hits a key bottom in the historical cycle
Technical analyst Trader Tardigrade focused on analyzing the monthly chart after prices hit the long-term uptrend line. Dogecoin previously hit this support level in 2017 and 2020, and has since risen sharply. The contact puts the asset again near the bottom of the same structure almost ten years after the first test.
(Tweet content: $Doge/Monthly Line #Dogecoin will rebound every time it touches this supporting trend line-and its gains are accelerating after each rebound. 2017: Touch → rise 2020: Touch → greater rise 2026: Touch →? This is a long-term support line that has lasted for nearly ten years. Each rebound is accelerating...) The chart shared by
marks each trend-line touch point with an upward arrow and a higher and higher yellow histogram. These markers represent stronger gains since previous touches, although historical performance does not predict future results. "The pattern is repeating. The next rise is in the works,"analysts wrote on Platform X.
As monthly support is again tested, the trading price of Dogecoin is roughly between US$0.070 and US$0.076. Market data shows that the token is close to US$0.073, while multiple long-term support indicators are also clustered in the same region. Holding this range will maintain the larger upward structure shown on the monthly chart.
Daily indicators show limited rebound
Dogecoin traded at approximately US$0.0731 on the daily chart, down approximately 0.4% on the day. The price is still $0.0739 below the Bollinger Band's mid-track, indicating limited buying control. However, US$0.0701 near the lower rail continues to provide support for the market in the recent weakness.
DOGE prices rebounded moderately after approaching $0.070 in early July. A daily break of US$0.0777 will break through the Bollinger Band and strengthen the current rebound. The breakthrough could put $0.080 close, but the chart has not yet confirmed the trend. 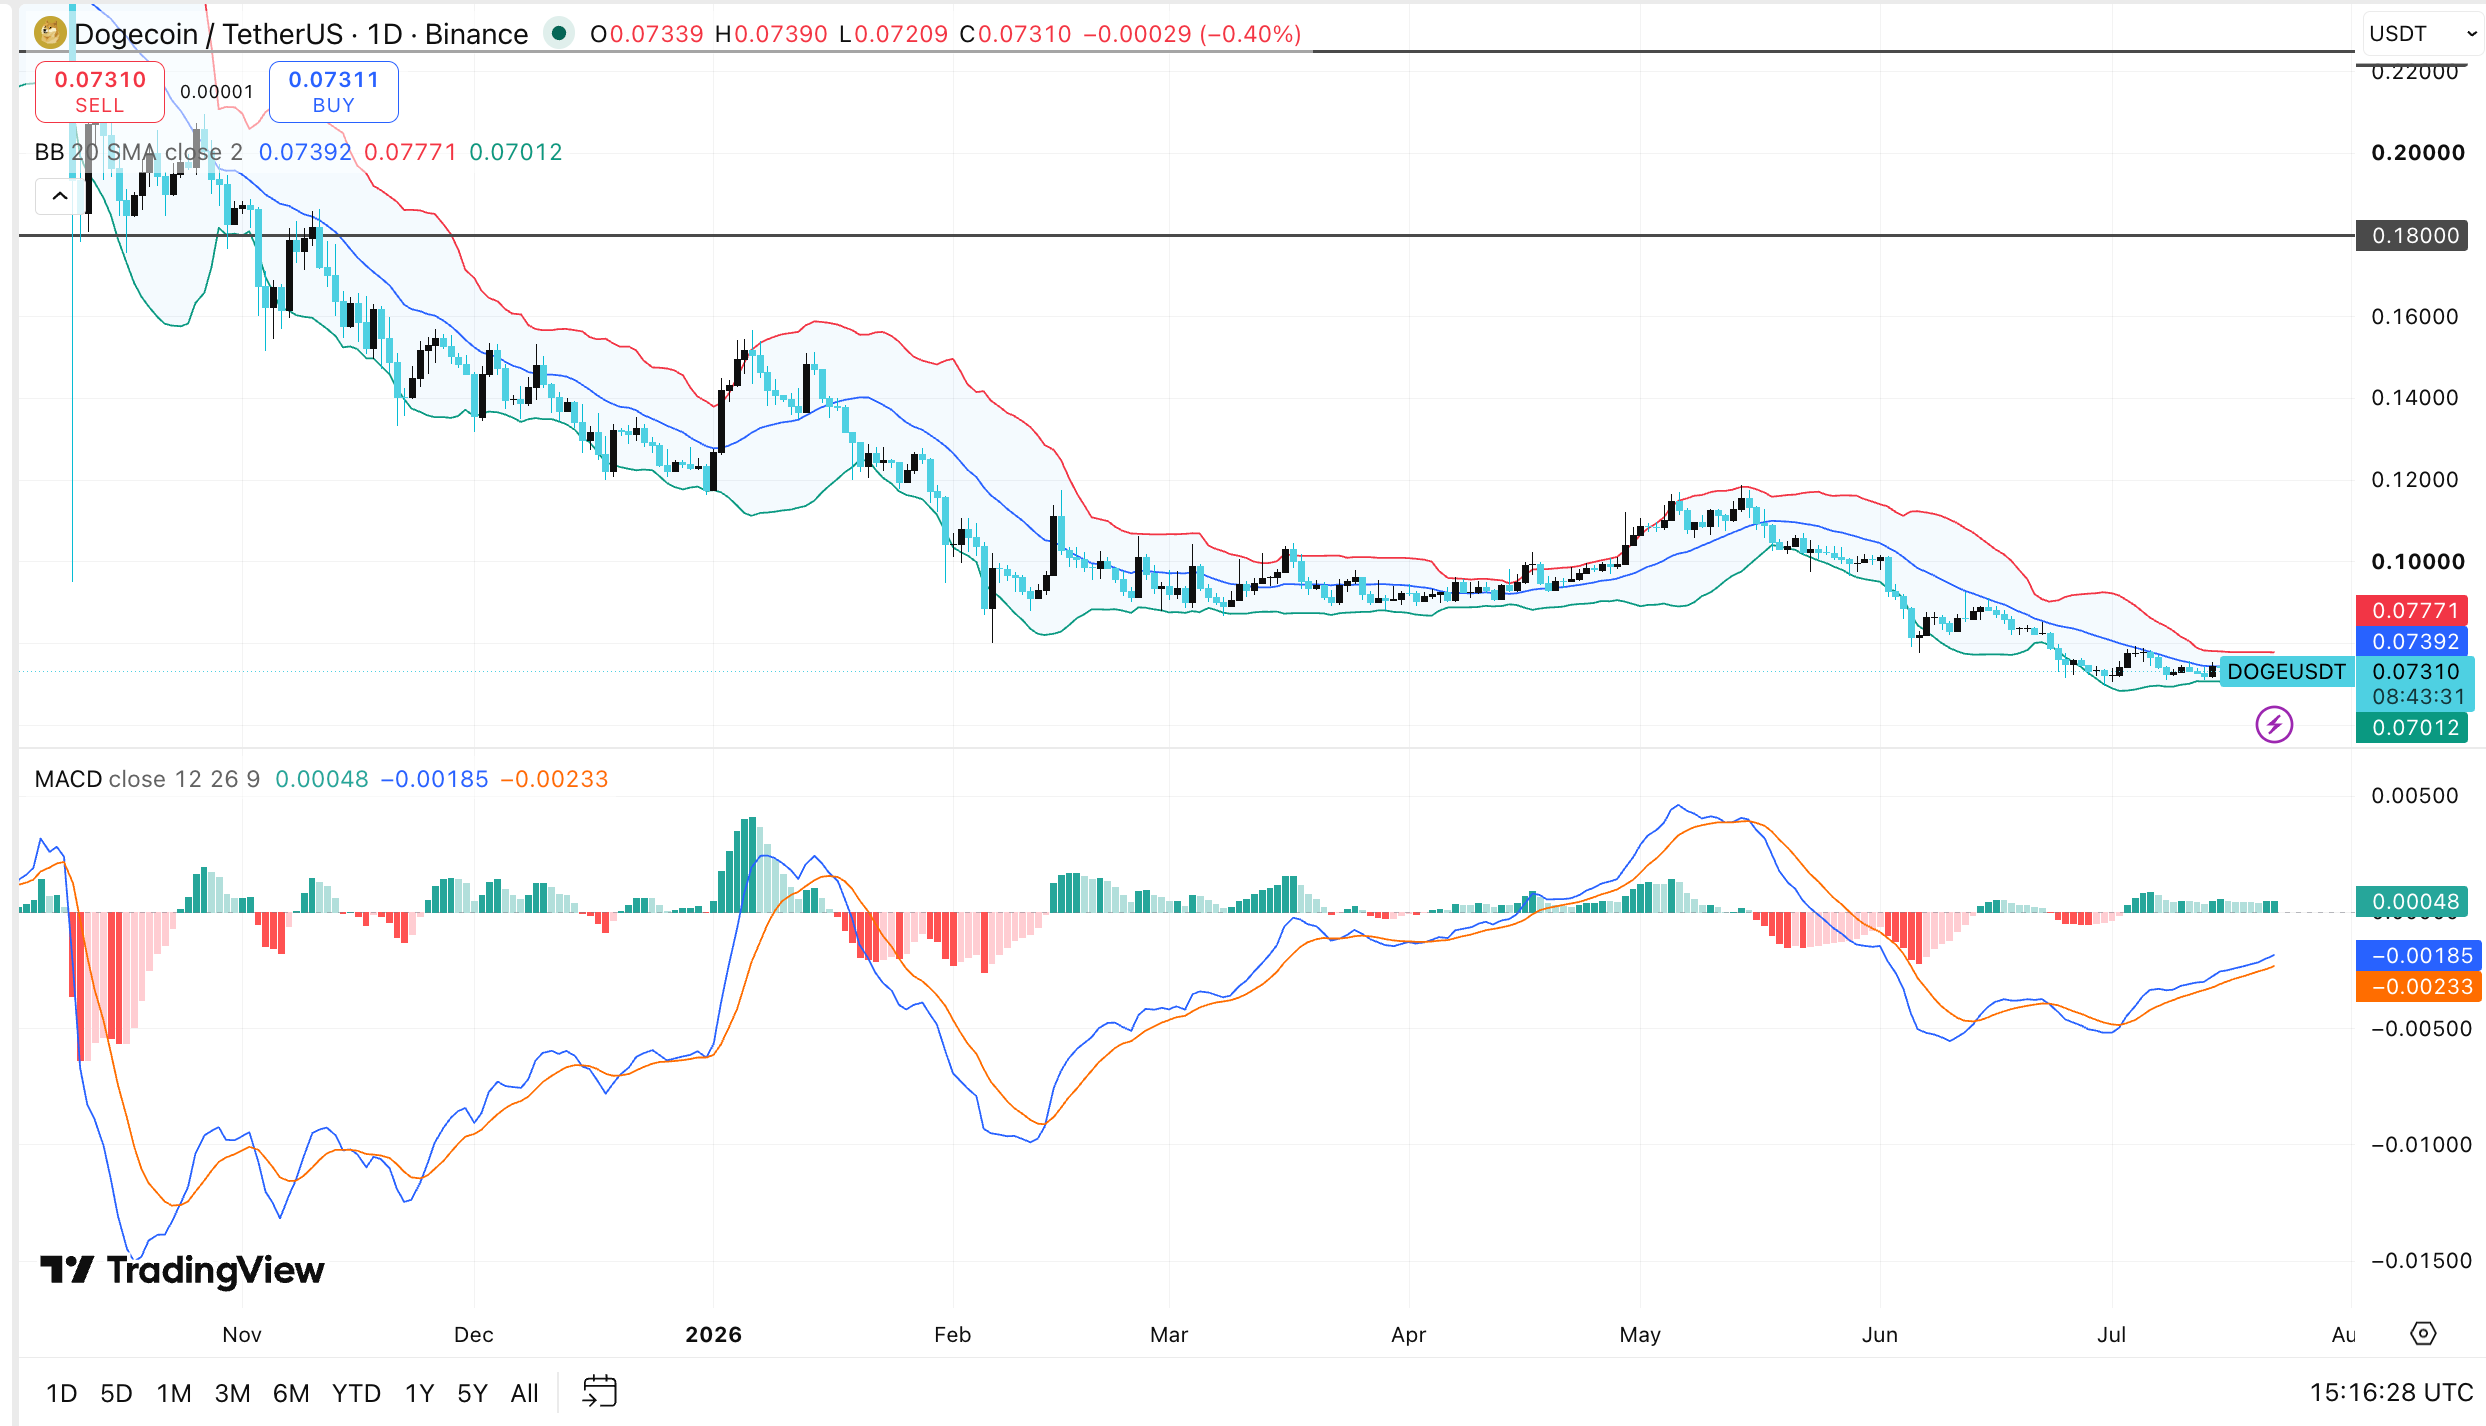
Dogecoin must also hold the $0.070 area to prevent further technical weakness. A daily close below this level could expose lower support areas and weaken long-term structures. As a result, the current range remains critical for short-term direction and broader trend stability.
The MACD line is above the signal line and the histogram remains positive. This pattern shows an improvement in bullish momentum after falling in early July. However, the two MACD lines remain below the zero axis, limiting the strength of the signal.
A breakthrough of US$0.0777 will confirm stronger price momentum on the daily chart. Such a trend will also put prices on the Bollinger Band.






















