
 Exchange Ranking
 Top Exchanges
 24h Volume Ranking
 Popularity Ranking
 Exchange BTC Balance
 Proof of Reserves
 Decentralized Exchanges
 Funding Rate
 Funding Heatmap
 Liquidation Data
 Max Pain
 Long/Short Ratio
 Whale L/S Ratio
 Binance/Okex/Huobi L/S
 Bitfinex Margin L/S
 ETF Tracker
 Solana ETF
 XRP ETF
 Hong Kong ETF
 Bitcoin Treasuries
 Crypto Reversal
 Ethereum Reserves
 HyperLiquid Wallet Analysis
 Hyperliquid Whale Watch
 Large Transactions
 On-chain Movement
 Bitcoin ROI
 Stablecoin Market Cap
 Options Analysis
 News
News Articles
 Economic Calendar
 Features
 Wallet
 Contract Calculator


 Security
 Collections
 Watchlist
 Following
 BTC
BTC  DOGE
DOGE  ETH
ETH  PEPE
PEPE  SHIB
SHIB The current trading price of Dogecoin is US$0.07232, down 1.2% in the past 24 hours. The recent trend has been difficult: prices have slipped above $0.10 since late May and have quietly bottomed out in the $0.072 to $0.075 range in the past few weeks. This dogcoin price forecast focuses on DOGE's next step in the cryptocurrency dogcoin market. If buyers re-enter and take the initiative, DOGE is expected to climb to recent volatile highs. On the contrary, if sellers continue to dominate, they are expected to delve into the lower support area again. Currently, the currency is trapped in a narrow range, waiting for a clear direction to break through.
DOGE Today's Price and Market Overview
To be honest, today's dogcoin news does not clearly point in any direction. DOGE reported $0.07232, down 1.2% in the past 24 hours within a narrow range of $0.07207 to $0.07345. The market value is approximately US$11.224 billion, the circulation supply is 155.184 billion DOGE units, and the total supply is 170.896 billion units. Since Dogecoin has no maximum supply cap, the usual fully diluted valuation discussion does not apply here as it does for limited supply tokens. 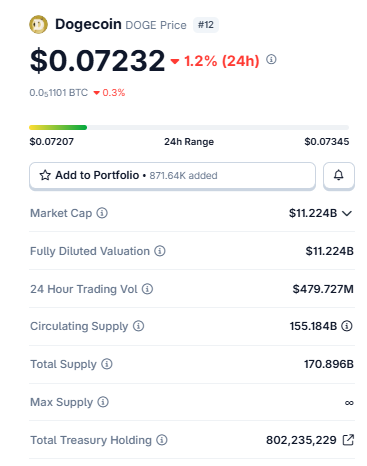 The 24-hour trading volume is approximately US$479.727 million, and the internet-related treasury holds approximately 802.23 million DOGE units. Currently, users holding dogcoin wallets do not see much fluctuations, but once the current pattern is broken, the situation may change quickly.
This grinding and lack of confidence in price movements was typical after a sharp sell-off in June. The token fell from above US$0.10 in late May to the US$0.072 to US$0.075 range and has since bottomed out in the region. Anyone who asks if Dogecoin will rise now needs to look at two charts simultaneously: the 4-hour triangle pattern and the 1-day trend line. Both are telling different versions of the same story.
Dogecoin clearing heat chart
Clearing heat chart data provides a useful background for price movements. In the past 24 hours, US$1.62 million in DOGE positions were liquidated, and the distribution was extremely uneven: US$1.52 million was long liquidations and only US$97.84 million was short liquidations. This liquidation wave was particularly concentrated during the 12-hour window, with long positions accounting for $813,930 of a total of $860,001 million in cleared positions. 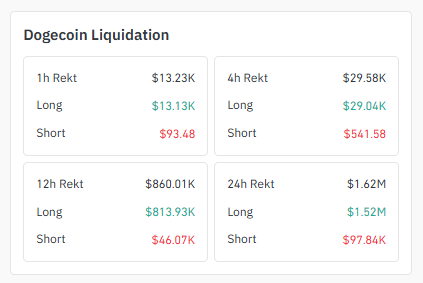 This is a typical feature of over-leveraged bulls being squeezed when pulling back from the $0.075 region. The good news for bulls is that since most weak hand leverage has been cleared, the risk of long liquidation immediately above current price levels has been reduced. The recent 1-hour and 4-hour windows showed a sharp drop in liquidation volume (US$13.23 million and US$29.58 million respectively), indicating that this round of liquidation is basically over, but if the triangular pattern breaks through in any direction, the situation may change quickly.
Dogecoin Exchange Trading Volume Heat Chart
The futures trading volume of Dogecoin is highly concentrated on two platforms. Binance leads with $275.86 million, followed by OKX with $179.06 million. Together, the two account for the majority of DOGE derivatives activity. 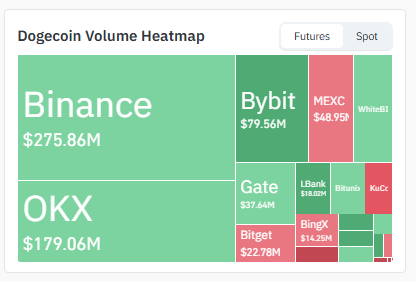 Bybit (US$79.56 million), MEXC (US$48.95 million), Gate (US$37.64 million), Bitget (US$22.78 million), LBank (US$18.02 million) and BingX (US$14.25 million) make up the remaining visible order flow.
This concentration is important for any investor tracking breakthroughs: since Binance and OKX dominate liquidity, real breakthrough confirmation should first come with a significant surge in volume on these two platforms. If the price breaks through US$0.07543 but Binance and OKX order books do not participate, then this is more likely to be a weak, low-liquidity test than a sustainable breakthrough.
DOGE Social sentiment and news
On social front, Today's Dogcoin News includes a widely circulated post from the account WhaleInsider announcing that the "Daily Do Good" DOGE entity has been registered as a limited liability company in Kentucky. Please note in advance: The post is marked as a paid collaboration, which means that this is sponsored content rather than independent reporting, so it should be regarded as promotional rather than confirmed, verified news.  Even so, if the information is accurate, the formal legal structure of entities associated with Dogecoin would be the kind of incremental development that would add to the broader narrative of Dogecoin ETFs and institutional legitimacy circulating this year, although it will not itself drive prices. There is still no confirmed release date for the Dogecoin ETF, but discussions about it resurface every few weeks during the DOGE news cycle, and even without any actual catalyst, the speculation itself tends to drive emotions.
The broader sentiment at the moment seems more technical than narratives driven: Traders are focusing more on triangles and trend lines than responding to headlines, which is consistent with flat price movements.
Comparison between DOGE and other Meme sector major currencies
Currencies| 24-hour change| Form
Dog Coin (DOGE)| -1.2% |Symmetric Triangle (4 hours)+ Trend Line Test (1 day)
Shiba Inu Coin (SHIB)| mixed| Oscillating in range near key supports
Pepe (PEPE)| mixed| Consolidating below previous highs
The comparison is for reference only and is based on general sector positioning; please always check the real-time charts to get the latest levels for each currency.
4-hour chart of dogcoin: symmetrical triangle approaches apex
Zoom in to a 4-hour cycle, DOGE has been building textbook-style symmetrical triangles since late June. Moving from a volatile high of $0.07935 to a lower high, and moving from the $0.06950 region to a higher low, these two trend lines are rapidly converging. The price is currently trading around $0.07236, basically on the lower boundary, with only a few K-lines left from the peak. 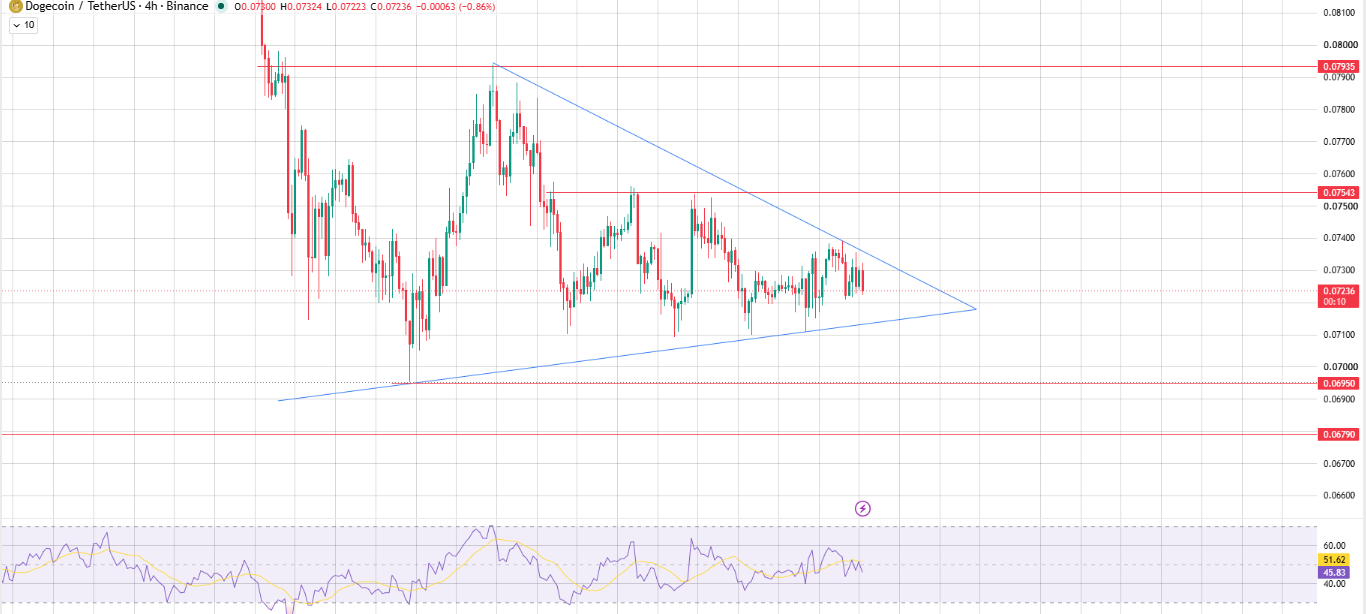 If prices turn downward and hit lower highs with each rally, the pattern will begin to resemble a downtrend channel rather than a clean symmetrical triangle, which will make the short-term bias more firmly bearish.
Inside the triangle, there is a clear midline to watch: $0.07543. It has served as intraday resistance many times and is therefore the first obstacle before any larger market occurs. Above it is $0.07935, the upper edge of the triangle, which confirms the level of a true bullish breakthrough if exchange volume matches. Below the form,$0.06950 is direct floor. If this support area falls, the next support level is $0.06790.
The 4-hour RSI reading was 51.62, with its moving average at 45.83, roughly near the midline. The momentum indicator is extremely neutral. It has not yet confirmed a breakthrough or break, but only reflects the turbulence of the market as it waits for the catalyst. Traders should consider any triangular breakout that is not matched by a surge in volume as suspicious. Low-volume breakthroughs in this squeeze often result in false breakthroughs and reverses.
Dogecoin 1-day chart: Trend line support becomes the focus
Broadening to the daily chart, the more macro picture becomes clearer. Since early July, DOGE has been supporting itself along an upward trend line, which is currently slightly below the $0.0710 to $0.0720 region. This trend line is the real key to judging the next direction of prices. As long as the correction continues to gain buying near this line, the pattern will first favor gains towards the price target area of $0.08249, then $0.09259, and finally $0.10108 (which suppressed the previous round of decline). 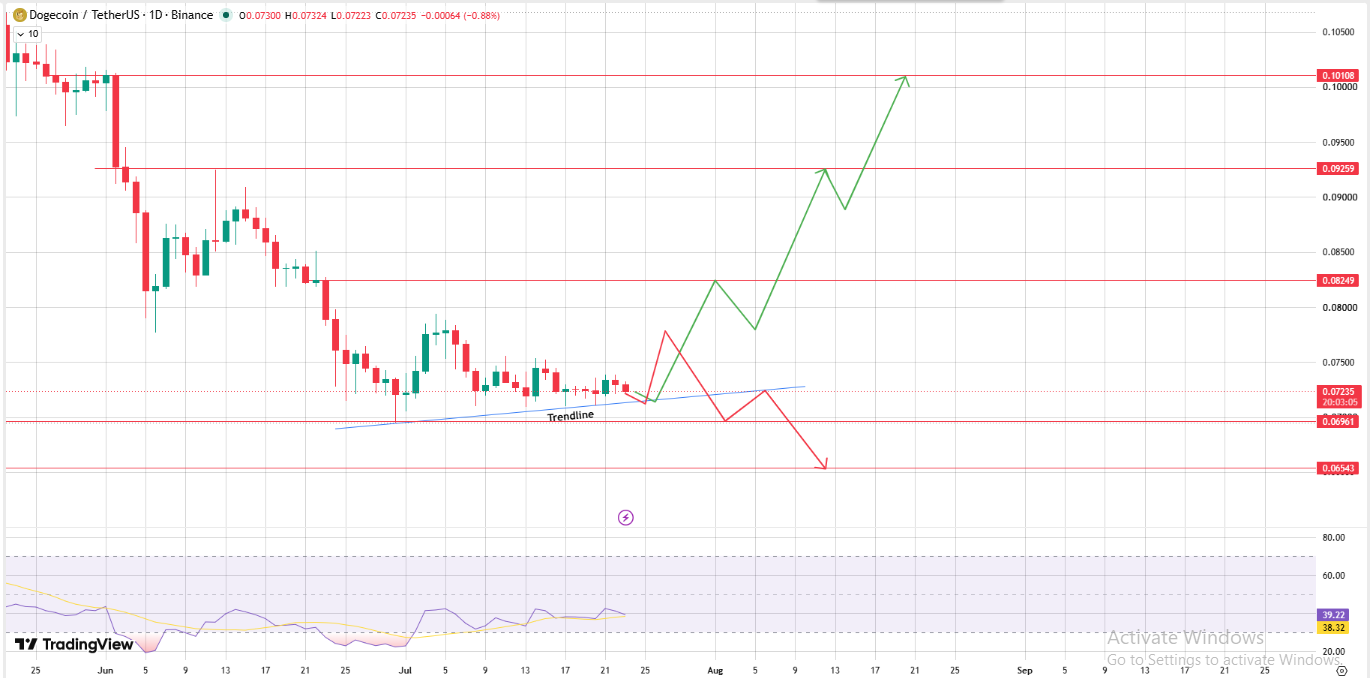
If the trend line falls below instead, the daily chart points to a far less friendly path. After confirming a bearish break below the line, the price will first fall back to the US$0.06961 pivot point. If this level falls, it goes down to the US$0.06543 support area, which roughly coincides with the lower boundary of the 4-hour triangle. The convergence of a break in the daily trend line with a four-hour triangular support makes $0.0654 to $0.0679 an important area to be observed as clusters, rather than just isolated numbers.
The daily RSI is 39.22, and its moving average is at 38.32, below the neutral 50 mark, but is bending upward from recent lows. This is consistent with the market being stabilizing rather than accelerating in either direction after being oversold in June. It is not a buy signal in itself, but it is not a warning signal either. It is the RSI reading you expect to see when the decisive move is imminent before the triangle pattern is resolved.
DOGE Price Forecast: Bullish, Fundamental and Bear Scenarios
scenario| trigger condition| short-term goals| Extended target
bullish| The 4-hour close was above US$0.07543 and volume increased; the 1st trend line held. | $0.07935| US$0.08249 → US$0.09259 → US$0.10108
Base| Prices are locked in a triangle, in the range of $0.0695 - 0.0754. | range volatility| RSI hovers between 50 - 55 and resolves
Beware| The trend line fell below on the 1st; the four-hour triangular support of US$0.06950 fell. | $0.06790| US$0.06961 → US$0.06543
This three-point method is more important than a single number. A dogcoin price forecast that ignores range fluctuations in the basic scenario is ignoring the current actual performance of the chart. DOGE is not in a trend, but is compressing, and once it breaks through, the compressed form will be released violently.
Final Outlook: Will Dogecoin rise?
Taken together: DOGE is at a real decision point, not a random position on the chart. Both the 4-hour triangle and the 1-day trend line were close to being resolved at similar points in time, while liquidation data showed that over-leveraged bulls had been eliminated to some extent. This reduces a source of downward pressure, but does not guarantee direction.
Dogecoin's price movements do not operate in isolation; broader BTC dominant trends, as well as ETH correlations among major currencies, often determine how much upside mainstream altcoins like DOGE actually have in any breakout. If Bitcoin maintains its own range stability, DOGE's triangular breakout is more likely to deduce cleanly in either direction based on its own structure. If BTC fluctuates, DOGE triangles will resolve faster and more chaotically than the clean lines on the chart suggest.
Currently, the key levels above are $0.07543 and $0.07935, the key levels below are $0.06950 and $0.06790, and the 1-day trendline near $0.0710 to $0.0720 is the main signal. Whether the dogcoin bull market trend can recover from its current level depends on the direction in which the triangle is broken by real volume, not whether DOGE will soon hit a dollar. The latter remains a longer-term issue related to total supply and market value calculations rather than a short-term chart pattern.
Quick Glossary
Some terms that appear frequently in this article, in case some are unfamiliar to you. A symmetrical triangle is essentially a squeeze: prices form a lower high on one side and a higher low on the other, and the two lines intersect at one point. Once you reach that point, you usually don't stay calm for long. Trend line support is a rising line drawn below a series of higher lows that traders use to see if buyers are still emerging during pullbacks. The liquidation heat chart shows leveraged positions close to forced liquidations, so it is a rough map of pain points on the chart. The RSI, or relative strength indicator, is a momentum indicator from 0 to 100; above 70 usually means overbought, below 30 usually means oversold, and close to 50 means the market cannot make up its mind.
A brief explanation of how this article is written
Each level in this article, whether it is a triangular boundary or a trendline area, is directly derived from the 1-day and 4-hour TradingView charts reviewed at the time of writing this article; nothing is extrapolated or speculated. Clearing and exchange volume data comes from Coinglass style data. Price, market cap and supply data are snapshots as of July 23, 2026, so some of these numbers may have changed as you read this article. Be sure to review the real-time charts before taking action on this article.
Disclaimer : This document is for information purposes only and does not constitute financial advice. The cryptocurrency market is highly volatile; please study for yourself before investing.






















