
 Exchange Ranking
 Top Exchanges
 24h Volume Ranking
 Popularity Ranking
 Exchange BTC Balance
 Proof of Reserves
 Decentralized Exchanges
 Funding Rate
 Funding Heatmap
 Liquidation Data
 Max Pain
 Long/Short Ratio
 Whale L/S Ratio
 Binance/Okex/Huobi L/S
 Bitfinex Margin L/S
 ETF Tracker
 Solana ETF
 XRP ETF
 Hong Kong ETF
 Bitcoin Treasuries
 Crypto Reversal
 Ethereum Reserves
 HyperLiquid Wallet Analysis
 Hyperliquid Whale Watch
 Large Transactions
 On-chain Movement
 Bitcoin ROI
 Stablecoin Market Cap
 Options Analysis
 News
News Articles
 Economic Calendar
 Features
 Wallet
 Contract Calculator


 Security
 Collections
 Watchlist
 Following
 ADA
ADA  DOGE
DOGE  TRX
TRX Dogecoin is still weak overall, but three analysts have found major signs of reversal.
From a large time frame, Dogecoin is still showing a bearish trend, and the daily chart is far from clear. Turn more. However, a number of technical signals indicate that the price of dogcoin may be approaching an important trend.
This possibility does not eliminate a broader downward trend. Before buyers regain control, the price of Dogecoin still needs to break through multiple resistance levels. Analysts Javon Marks, Ali Charts and Trader Tardigrade have now identified different chart patterns that support potential reverse bullish signals.
Each analyst used a different approach. Javon Marks studies past altcoin cycles, Ali Charts focuses on TD Sequential indicator signals, and Trader Tardigrade analyzes price movements and relative strength indices.
Javon Marks believes that dogcoin prices may repeat previous altcoin cycles
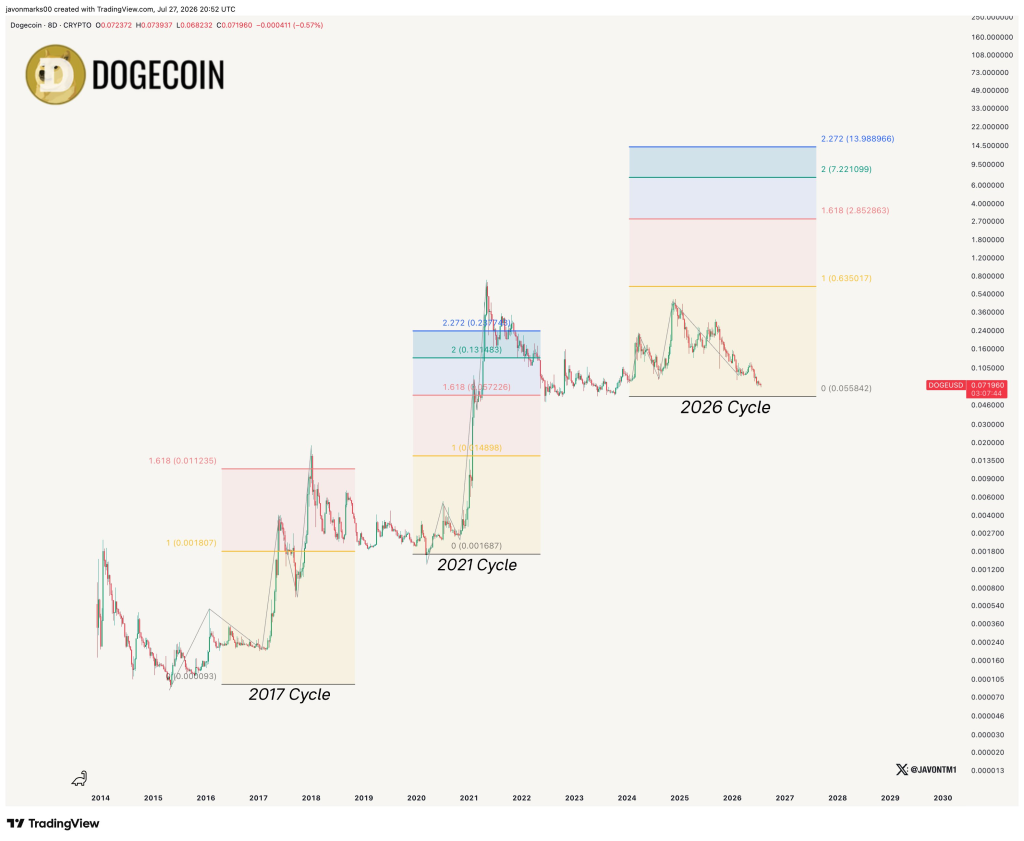
Cryptocurrency analyst Javon Marks studied the performance of dogcoin in the 2017 and 2021 cycles. His chart compares these two periods with the developing 2026 cycle and applies a Fibonacci extension level to each cycle.
Judging from the dogcoin chart, in the previous major altcoin cycles, DOGE prices exceeded the 1.618 Fibonacci extension. Marks believes that another strong altcoin cycle may allow dogcoin prices to repeat this historical pattern.
 @JavonTM1 / X
The chart shows three important details:
In the 2017 cycle, Dogecoin exceeded the 1.618 Fibonacci level.
In the 2021 cycle, DOGE also broke through this expansion level.
The 1.618 Fibonacci extension for the current cycle is around $2.85.
Marks has set its main price target above $2.82. Dogecoin needs to rise by more than 3800% from the current region to reach this price. Such an increase would be close to 40 times.
This forecast is highly dependent on a repeat of history. Past results do not guarantee that dogcoin prices will follow the same path again. Market value, available liquidity, investor demand and the strength of the next altcoin cycle will determine whether such a rise is possible.
The chart also uses a logarithmic scale, which compresses large price changes between cycles. This format facilitates long-term comparisons, but may make extreme targets seem closer than they actually are.
Dogecoin prices reaching US$2.82 requires much more than just a small rebound in technology. DOGE needs a strong market cycle and enough capital to support valuations well above current levels.
Ali Charts detects buy signals for Dogecoin over multiple time frames
Ali Charts detects another sign supporting a possible reversal in the price of Dogecoin. The analyst reported that the TD Sequential indicator generated buy signals on monthly, weekly, 3-day and daily charts.
The TD Sequential indicator analyzes a series of K-lines to identify periods when the trend may be close to exhaustion. A buy signal may be followed by continued selling pressure, which usually indicates that short power is weakening.
Dogecoin $DOGE is sending a strong bullish signal! TD Sequential has flashed buy signals on monthly, weekly, 3-day and daily charts. It is rare for this alignment to occur simultaneously in so many time frames.
Ali's chart shows the TD Sequential markers on all four time frames. This alignment is important because signals over longer periods are usually more component than the signals on the K-line on a single day.
Monthly and weekly signals suggest that the broader downtrend may be close to exhaustion. The 3rd and daily readings focus on the more recent price structure of Dogecoin. They appear at the same time over similar periods of time and form a stronger technical basis than any single reading.
However, the indicator does not confirm how much DOGE prices can increase. The TD Sequential buy signal may appear before the rebound, but prices may still straighten out or bottom out again. Price confirmation remains essential. Before the broader chart becomes clearly bullish, Dogecoin must recover nearby resistance levels and hold on to these rising levels.
Trader Tardigrade identifies three bullish signals on the dog coin daily chart
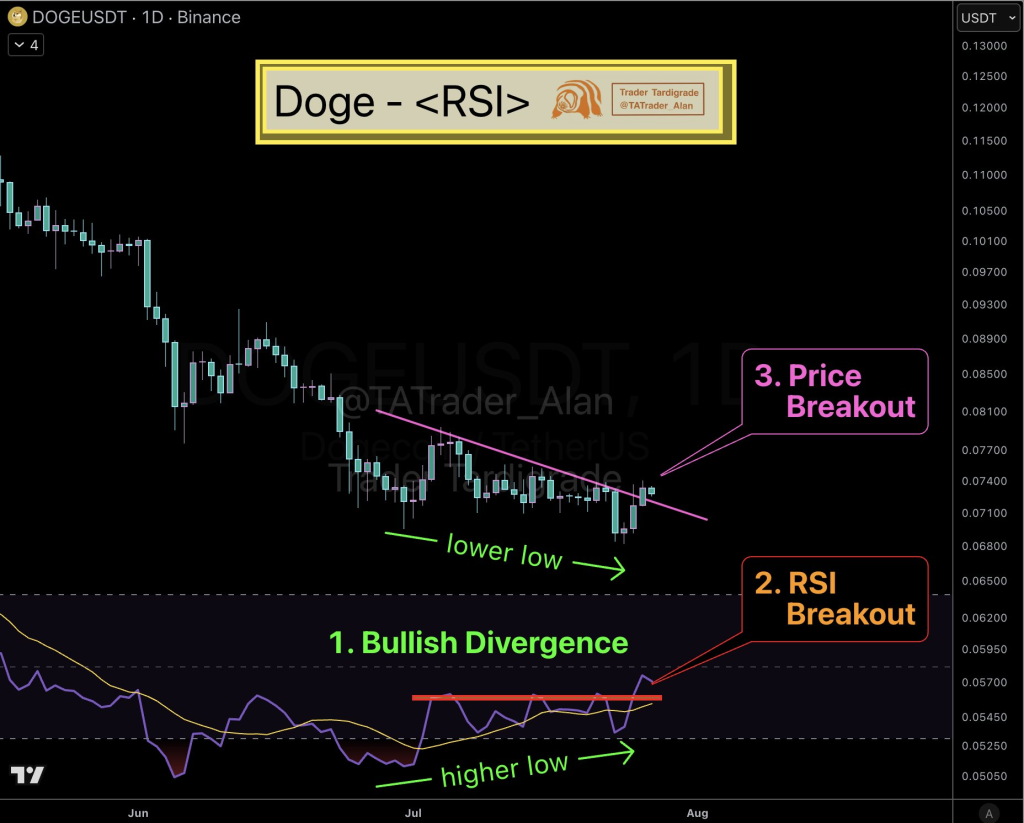
Trader Tardigrade studied the daily chart of Doggecoin and found three bullish signals in the same structure. His analysis focuses on bullish divergences, RSI breakthroughs, and price breaks through downtrend lines.
The first signal comes from the divergence between DOGE prices and the Relative Strength Index. Dogecoin formed a lower low, but the RSI formed a higher low. This bullish divergence suggests that even if prices fall, selling momentum may have waned.
The second signal involves the RSI breaking through horizontal resistance. This suggests that the momentum below the surface of the price chart is improving.
 @TATrader_Alan / X
The third signal comes from DOGE prices breaking upwards of a downtrend line. The trend line connects a series of lower periodic highs and serves as resistance during the decline.
Trader Tardigrade believes that these three signals combined constitute a confirmation inversion. However, before the broader market structure supports this conclusion, Dogecoin must remain above the trend line it has breached and continue to clear price resistance.
False breakthroughs are still possible when trading volumes are sluggish or the broader trend remains short. Falling back below the trend line will weaken the validity of this signal.
The price of dogcoin must first exceed US$0.075 to challenge higher resistance levels
Dogecoin is currently trading around $0.070, which puts DOGE close to the first major resistance level on the daily chart. Direct resistance is around $0.075. Confirmation of a breakthrough of $0.075 may open up space for moving towards $0.078. The price of Dogecoin will then face another test, because even if the breakthrough is successful, the previous resistance level may still refuse the price to continue to rise.
Continued strength above US$0.078 may make US$0.089 a target. This level is the strongest resistance level among nearby targets and may require more buying volume to break through it.
Therefore, the bullish path follows a clear sequence:
A breakthrough of $0.075 could push DOGE to $0.078.
Crossing $0.078 may expose resistance near $0.089.
A solid recovery above US$0.089 will improve the broader daily structure.
Dogecoin's current direct support is around US$0.068. Buyers have recently defended the area, making the position critical to the short-term outlook. A clear break below $0.068 could extend the decline and weaken the bullish signals identified by three analysts. Such a trend will indicate that sellers still control the daily price structure of Dogecoin.
FAQs
Can DOGE reach $1? It is theoretically possible, but the probability is extremely low. The historical high of dogcoin is US$0.74, which will be reached on May 8, 2021.
Which currency will reach 1 dollar in 2026? Dogecoin is widely regarded as a realistic candidate for reaching $1, with a market value of approximately $150 billion and is supported by the integration of XPay infrastructure and its vast community. For business and first-level practicality, Cardano and TRON are high-profile alternatives that currently trade for less than $1 and have potential.






















