Exchange Ranking
 Top Exchanges
 24h Volume Ranking
 Popularity Ranking
 Exchange BTC Balance
 Proof of Reserves
 Decentralized Exchanges
 Funding Rate
 Funding Heatmap
 Liquidation Data
 Max Pain
 Long/Short Ratio
 Whale L/S Ratio
 Binance/Okex/Huobi L/S
 Bitfinex Margin L/S
 ETF Tracker
 Solana ETF
 XRP ETF
 Hong Kong ETF
 Bitcoin Treasuries
 Crypto Reversal
 Ethereum Reserves
 HyperLiquid Wallet Analysis
 Hyperliquid Whale Watch
 Large Transactions
 On-chain Movement
 Bitcoin ROI
 Stablecoin Market Cap
 Options Analysis
 News
News Articles
 Economic Calendar
 Features
 Wallet
 Contract Calculator


 Security
 Collections
 Watchlist
 Following
 DOGE
DOGE Momentum indicators send mixed signals
Derivatives data point to high position levels
DOGE trading prices are close to US$0.0835, forming a downward wedge on the 1-hour chart. The $0.110 - 0.120 region is a key resistance level for traders to observe breakthroughs. Analyst Crypto With Gopal pointed out that if the wedge breaks upwards,$0.150 could become a potential target. Despite a 3.10% decline in trading volume, open interest still rose 1.92% to $1.27 billion. A support level of $0.080 is seen as key to maintaining a bullish pattern.
Dogecoin is currently trading at approximately US$0.0835. The token's short-term chart is forming a "downward wedge" pattern, which some traders view as an early signal of a potential reversal. The wedge consists of a narrowing trend line, with prices compressing between support around $0.100 and a resistance band between $0.110-$0.120. Cryptocurrency analyst Crypto With Gopal posted the setting on the X platform and marked the wedge on the 1-hour chart. In his post, he pointed out the need to pay close attention to the key level of $0.100 and claimed that once a breakthrough in the $0.110 - 0.120 range is confirmed, it will open the door to move towards $0.150.
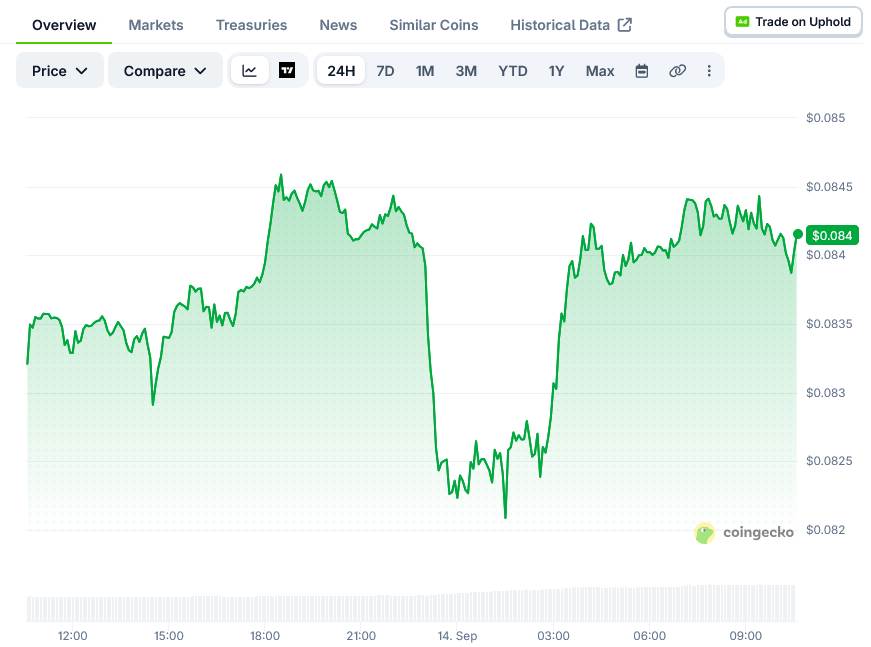
This resistance zone is the first obstacle. Only if the closing price is above this region can the breakthrough argument gain more weight. If DOGE clears the area, the target is expected to be close to $0.150. This marks a significant increase from current levels. On the other hand,$0.080 is the level of concern for traders. A break below that level could weaken the current bullish structure and open up room for further declines.
The momentum indicator shows a mixed signal
DOGE consolidated around US$0.07000 during July and August, with the Bollinger Band tightening during this period. A breakthrough in mid-August pushed prices towards $0.10,000. The rally then stalled and prices fell back to about $0.08449 due to strong resistance. DOGE is currently trading below its 20-day simple moving average, which is around $0.08589. The Lower Rail Bollinger Belt is located near $0.08003. The MACD line has crossed below the signal line and the histogram has turned negative. This shows that despite the formation of a wedge shape, the seller still holds some short-term control.
Derivatives data points to high position levels
Coinglass data showed 24-hour trading volume fell 3.10% to approximately $710.71 million. At the same time, open interest rose 1.92% to approximately $1.27 billion. The decline in trading volume was accompanied by a rise in open interest, indicating that traders were holding leveraged positions rather than closing them. This setting may lead to more drastic price fluctuations when a break or break occurs. Separate data from Doggegod shows that open interest is approximately 16.38 billion DOGE, valued at nearly US$1.5 billion. Such high position levels mean a breakout could trigger rapid movements in both directions. Currently, DOGE is still hovering between US$0.080 support and US$0.110 - 0.120 resistance. Traders are watching these two levels for the next directional signal.