Exchange Ranking
 Top Exchanges
 24h Volume Ranking
 Popularity Ranking
 Exchange BTC Balance
 Proof of Reserves
 Decentralized Exchanges
 Funding Rate
 Funding Heatmap
 Liquidation Data
 Max Pain
 Long/Short Ratio
 Whale L/S Ratio
 Binance/Okex/Huobi L/S
 Bitfinex Margin L/S
 ETF Tracker
 Solana ETF
 XRP ETF
 Hong Kong ETF
 Bitcoin Treasuries
 Crypto Reversal
 Ethereum Reserves
 HyperLiquid Wallet Analysis
 Hyperliquid Whale Watch
 Large Transactions
 On-chain Movement
 Bitcoin ROI
 Stablecoin Market Cap
 Options Analysis
 News
News Articles
 Economic Calendar
 Features
 Wallet
 Contract Calculator


 Security
 Collections
 Watchlist
 Following
 BTC
BTC  DOGE
DOGE  ETH
ETH  SOL
SOL  XRP
XRP Key Insights
The rise in Bitcoin prices has helped the total market value of the crypto market return to the US$3 trillion mark. The U.S. spot Bitcoin ETF recorded a daily net inflow of US$999 million. Downward liquidity is mainly concentrated in the range of US$80,500 to US$85,000.
On September 22, Bitcoin prices were trading around US$86,000, and the total market value of the cryptocurrency market returned to the US$3 trillion mark. CoinGecko data showed that Bitcoin rose by about 5% in 24 hours, while the total market value rose by about 4%. This trend continues the recovery that previously pushed BTC above multiple long-term technical reference points.
The broader rally is significant because Bitcoin still controls more than half of the total market value of the crypto market. CoinGecko also showed that the total daily crypto transaction volume is approximately US$157 billion. Bitcoin's dominance remains at around 57%, allowing it to play a pivotal role in the recovery of market value. ETF demand accompanied the rally, while derivative positions introduced downside risks.
The soaring price of Bitcoin pushed the market value above US$3 trillion
CoinGecko data showed that the total market value of cryptocurrencies was close to US$3.01 trillion on Tuesday. The market value of Bitcoin reached approximately US$1.72 trillion on that trading day. CoinGecko tracks 20,253 cryptocurrencies on 1,501 exchanges in its global market cap data set.
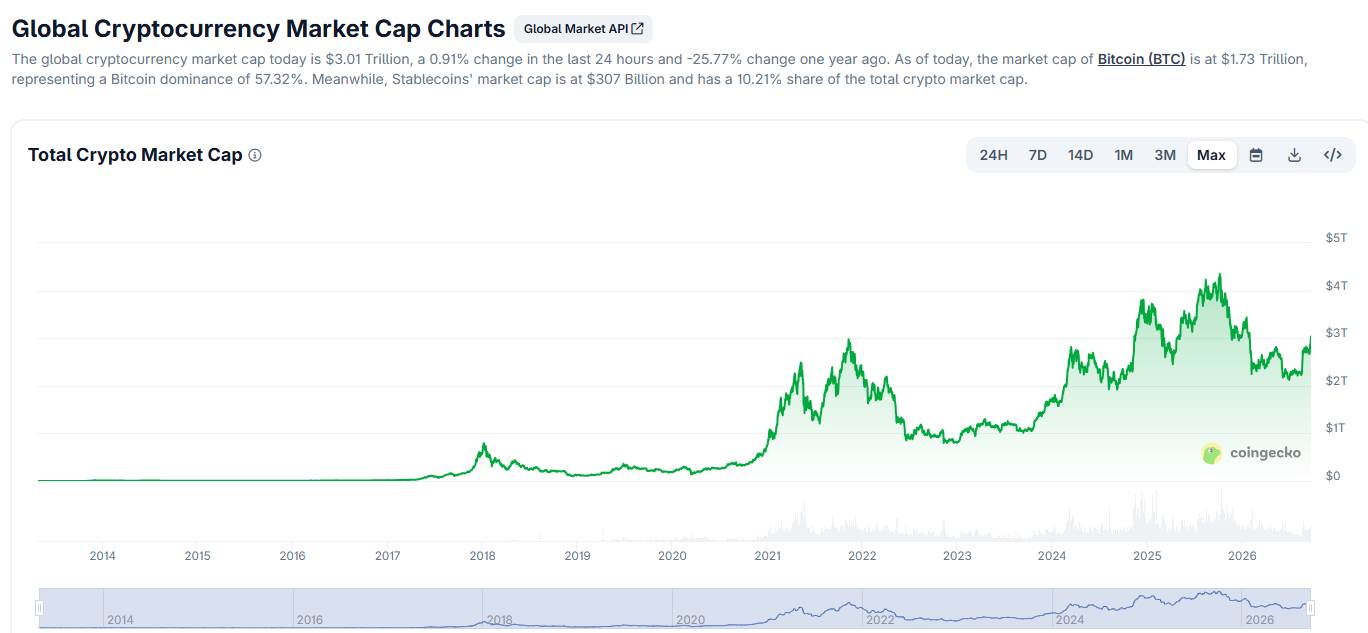 Crypto Market Chart. Source: CoinGecko
同期以太坊价格在2,740美元附近交易,XRP、Solana和Dogecoin也均有所上涨。这表明复苏范围已超出比特币,尽管比特币仍是按市值计算的主要贡献者。
CoinGecko第二季度报告显示,截至6月底,总市值为2.1万亿美元,较上一季度下跌12.6%。因此,周二的走势进一步延伸了从第二季度较弱收盘以来的反弹势头。
根据CoinGecko的数据,比特币在周二交易期间的价格在85,600美元至86,100美元之间波动。随着买家延续9月份的反弹势头,该资产过去七天的涨幅约为10%。
美国现货比特币交易所交易基金(ETF)提供了另一项需求信号。Farside Investors记录显示,9月21日净流入量为9.99亿美元,为本月最强的单日总额。BlackRock的IBIT吸引3.814亿美元,Fidelity的FBTC吸引2.388亿美元。ARK 21Shares比特币ETF增加2.891亿美元,表明资金流入分散在多个主要产品中。
此次流入紧随一周波动剧烈的基金需求之后。Farside记录显示,9月15日出现4.504亿美元的流出,9月16日又有2.959亿美元流出。随后资金流向转为正值,直至周一的大额配置。
比特币价格收复长期技术点位
Glassnode表示,比特币在低于其长期移动平均线约300天后,已收复这些均线。这家分析公司称,守住这些均线将支持长期趋势结构。
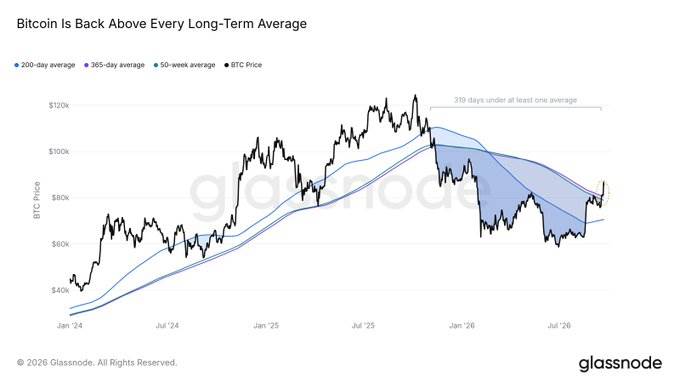 来源:Glassnode
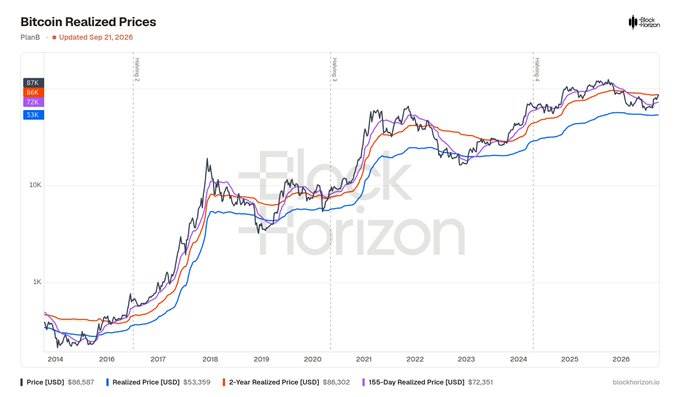
PlanB另外指出,BTC已突破几项实现价格指标。他在9月22日的帖子中将广义实现价格置于53,000美元附近,将155天指标置于72,000美元附近。
 来源:X
来源:X
PlanB还将两年期实现价格定在86,000美元左右。该水平与周二的现货价格相近,使其成为近期参考点而非远期支撑位。
实现价格指标追踪不同持有群体的总获取成本。交易价格高于这些指标可能表明有更多供应位于其估计成本基础之上。
杠杆率上升,下行流动性依然密集
这波涨势也与更重的衍生品头寸同步发展。CoinGlass追踪主要交易所的清算情况和未平仓合约规模。更高的杠杆率可能会在快速变动期间加剧价格波动。
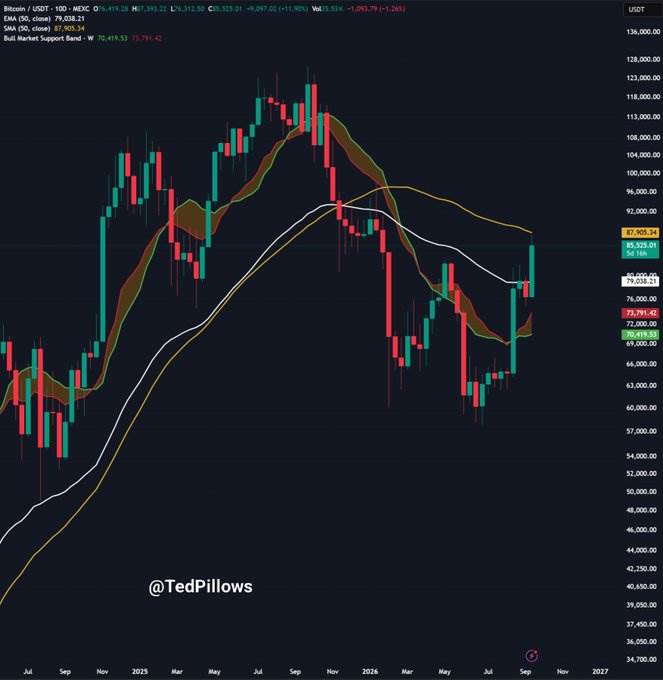 BTC/USD 日线价格图表。来源:X
交易者Ted识别出现货下方的三个短期流动性集群。他将它们分别定位在85,000美元、83,500美元和80,500美元附近。Ted将这些区域描述为包含晚期多头头寸的区域。
这些水平之所以重要,是因为清算集群可能在波动时段吸引价格。然而,这并不能保证价格下跌或决定比特币接下来的交易方向。
这种格局形成了分裂结构。现货和ETF需求支撑了涨势,而杠杆头寸增加了对回调的敏感度。
在比特币快速通过几个阻力区后,这种区分变得更为相关。当价格反向运动并靠近附近的流动性集中度时,快速上涨可能会使杠杆多头头寸暴露在外。
BTC在触及87,910美元前测试93,060美元阻力位
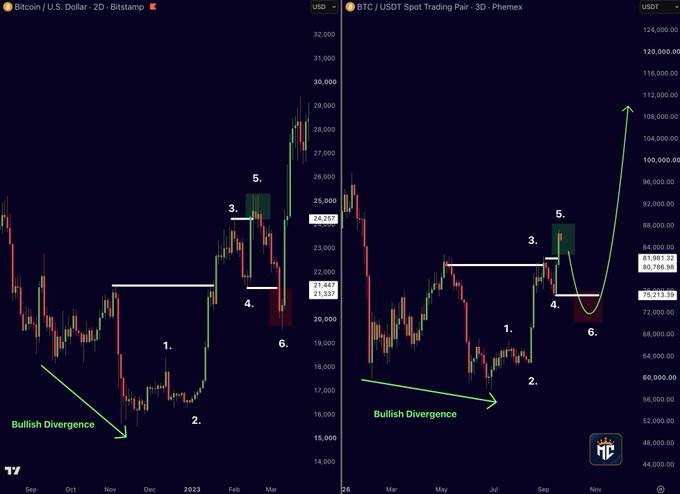
Mister Crypto确定2026年年初开盘价87,910美元为下一个技术测试点。他将2025年年初开盘价定在93,060美元附近,这将成为其上方的另一个阻力区。
 来源:X
来源:X
因此,比特币在周二进入了即时支撑位与附近突破位之间的区域。若能持续站稳年初开盘价上方,注意力将转向更高的阻力区。
若未能守住近期的突破位,焦点将转向现货下方确定的流动性水平。第一个区域大约在85,000美元,其次是83,500美元和80,500美元。
下一个可验证的催化剂是9月22日交易日结束后的每日美国现货比特币ETF资金流更新。围绕87,910美元的价格行为也将显示BTC能否扩展市值复苏。