Exchange Ranking
 Top Exchanges
 24h Volume Ranking
 Popularity Ranking
 Exchange BTC Balance
 Proof of Reserves
 Decentralized Exchanges
 Funding Rate
 Funding Heatmap
 Liquidation Data
 Max Pain
 Long/Short Ratio
 Whale L/S Ratio
 Binance/Okex/Huobi L/S
 Bitfinex Margin L/S
 ETF Tracker
 Solana ETF
 XRP ETF
 Hong Kong ETF
 Bitcoin Treasuries
 Crypto Reversal
 Ethereum Reserves
 HyperLiquid Wallet Analysis
 Hyperliquid Whale Watch
 Large Transactions
 On-chain Movement
 Bitcoin ROI
 Stablecoin Market Cap
 Options Analysis
 News
 Articles
 Economic Calendar
 Features
 Wallet
 Contract Calculator


 Security
 Collections
 Watchlist
 Following
 WLD
Worldcoin rebounded to $0.5644, and buying stayed at the $0.56 mark, but the daily RSI divergence signal suggested weakening momentum.
WLD gained support around $0.58, with $0.55,$0.54 and $0.53 being key support levels. The increase in trading volume supported the recovery of prices, and the Parabolic SAR indicator remained bullish despite the formation of RSI divergences.
As the RSI momentum weakens, the market is wary of the persistence of the current rally, and Worldcoin is testing its rebound near recent highs.
The structure of the rally above key supports
MarketSniper Pro noted that the WLD formed a bearish divergence on its daily chart. Analysts noted that prices hit higher highs, while RSI hit lower highs. However, the parabolic SAR still maintains a bullish signal, which means that there is no sign of confirmation of a reversal.
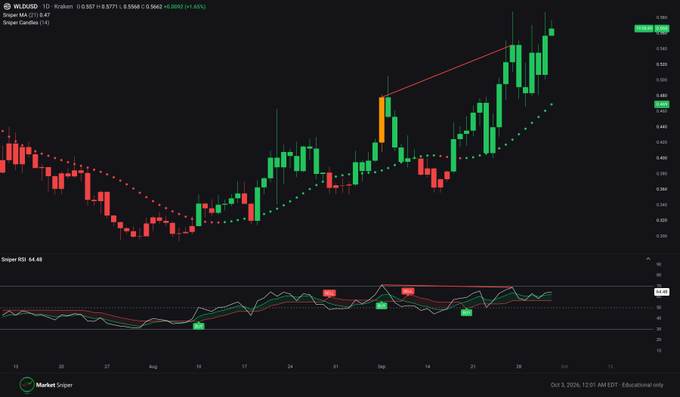
Worldcoin rebounded from the $0.30 area after a long period of selling pressure in July. During that decline, prices formed lower highs and lower lows, before selling pressure gradually eased. By August, buying began to build higher lows on the daily chart.
As the rebound in August strengthens, the positive line appears more and more frequently. Since then, prices have extended the consolidation period and consolidated the incipient bull trend. The market advanced slightly faster in September, with some positive lines hitting the $0.56 range.
As of writing, Worldcoin was trading at $0.5644, up 6.01% from the previous day. The price had previously dropped to $0.53, and then buying entered to bottom out. This rally pushed WLD back to $0.57 and $0.58, but suffered selling pressure taking at that position.
A bearish divergence appears against the background of rising prices
The daily RSI is currently at around 64.48, still above the neutral level of 50 and below the traditional overbought threshold of 70. Therefore, despite the lower RSI peak, overall momentum is still seen as positive.
When momentum fades, a bearish divergence may signal a consolidation or correction. However, this pattern does not immediately form a clear downward trend. Even if RSI levels slowly decline, prices are likely to continue to climb.
The parabolic SAR is still below the K line of the daily line. Despite the RSI's warnings, its green dots are still tracking the upward trend. A bearish rollover in the parabolic SAR will provide additional evidence for weakening trend conditions.
The next major price range for the current rebound is $0.55 to $0.56. If it can exceed $0.56, it is expected to push further to $0.57 and $0.58. Conversely, if prices fail to break through the $0.58 resistance zone, the focus may shift to lower support again.
$0.58 resistance level defines the next round of price testing
In recent rebound attempts, the $0.58 area has repeatedly encountered selling pressure. If we can continue to stand above this level, it will extend the current upward structure. Trading activity is crucial when assessing whether such breakthroughs are effective.
Short-term downside risk concerns are first focused on $0.55, below which is a lower support level. Below this,$0.54 and $0.53 provide additional viewing areas. A break below these ranges may weaken the rebound structure.
The latest data shows that WLD's trading volume in the past 24 hours was approximately US$637 million, an increase of 34.74%, and the trading volume accounted for 29.76% of the market value. During the reporting period, its market value was close to US$2.14 billion.
Out of the total 10 billion tokens, approximately 3.79 billion WLD tokens are in circulation. At the same time, despite repeated rejections, buying continued to intervene at high prices. The next few trading days will show whether market momentum will accumulate further or enter a consolidation stage.