
 Exchange Ranking
 Top Exchanges
 24h Volume Ranking
 Popularity Ranking
 Exchange BTC Balance
 Proof of Reserves
 Decentralized Exchanges
 Funding Rate
 Funding Heatmap
 Liquidation Data
 Max Pain
 Long/Short Ratio
 Whale L/S Ratio
 Binance/Okex/Huobi L/S
 Bitfinex Margin L/S
 ETF Tracker
 Solana ETF
 XRP ETF
 Hong Kong ETF
 Bitcoin Treasuries
 Crypto Reversal
 Ethereum Reserves
 HyperLiquid Wallet Analysis
 Hyperliquid Whale Watch
 Large Transactions
 On-chain Movement
 Bitcoin ROI
 Stablecoin Market Cap
 Options Analysis
 News
News Articles
 Economic Calendar
 Features
 Wallet
 Contract Calculator


 Security
 Collections
 Watchlist
 Following
 BTC
BTC TL;DR
Catalog
TL;DR
Chain pressure indicators have been out of the dangerous range.
Historical cycles show why the 40% level is critical.
On-chain data suggests caution, not panic, about Bitcoin.
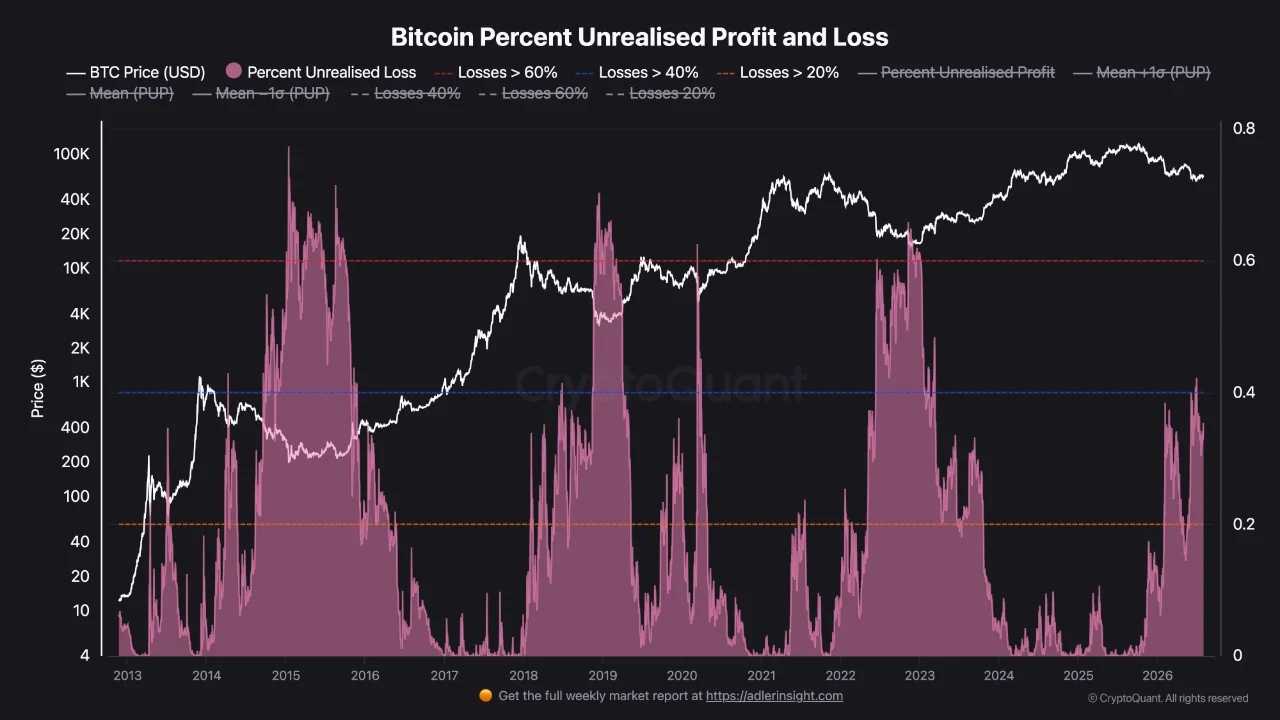
Bitcoin's unrealized loss percentage has dropped to 35.2% from a recent high of 42.2%.
The indicator has fallen below the 40% deep pressure band, but is still above the 20% warning level.
The historical cycle shows that after the indicator breaks through 40% for the first time, it is often accompanied by a long period of consolidation before recovery or surrender selling occurs.
The chart shows that investor pressure has eased, but the indicators on the chain have not yet signaled that the market has fully reset.
Bitcoin investors are showing signs of recovery from the recent period of market pressure, with on-chain data showing that the proportion of tokens in unrealized losses has fallen below a key historical threshold.
According to the latest CryptoQuant data, Bitcoin's unrealized loss percentage is currently 35.2%, which means that about one-third of the tracked supply of bitcoins is currently priced at less than its purchase cost.
This reading is an improvement from the end of June, when the indicator climbed to 42.2%, briefly breaking through the historically important 40% deep pressure zone. The indicator then fell back to 30.4% around July 21, and then rebounded to its current level.
BTC data source: CryptoQuant
Although the latest data points to improving market conditions, analysts note that the level of unrealized losses remains high compared to healthy periods of previous market cycles.
On-chain Pressure Indicator Out of Danger Range
An accompanying chart tracks Bitcoin's percentage of unrealized losses versus the asset's long-term price performance.
The purple area represents the proportion of Bitcoin supply in circulation currently in unrealized losses, while the white line tracks the market price of Bitcoin over multiple market cycles.
Historically, readings above 20% indicate increased market pressure, while a breakthrough of 40% usually coincides with deeper bear market conditions. The 60% threshold usually marks the market entering a capitulation selling phase, when selling pressure and investor panic are prevalent.
The latest reading, which dropped to 35.2%, has put Bitcoin back under deep pressure, indicating that some of the pressure it endured during recent price weakness has eased.
Historical cycles show why the 40% level matters
The chart highlights previous market cycles in which the unrealized loss percentage exceeded the 40% threshold during prolonged bear markets and moved further towards 60%.
In the downturns in 2014-2015, 2018-2019 and 2022, the first time the indicator entered the 40% region did not immediately mark the market's bottom. Conversely, Bitcoin typically enters a period of volatile consolidation and then either recovers or experiences a final wave of capitulation.
Unlike those earlier cycles, the current reading has dropped below 40% relatively quickly, indicating that selling pressure has eased rather than intensified.
From a technical perspective, the chart shows that the indicator of unrealized losses has fallen below the historical deep pressure threshold. Current levels are still well below the 60% area that has historically been accompanied by widespread panic selling. Many holders still face negative returns.
On-chain data suggests caution, not panic, about Bitcoin
The unrealized loss indicator is widely used by on-chain analysts to assess investor sentiment because it measures the proportion of Bitcoin holders who are at paper losses.
High readings usually reflect deteriorating market confidence, while lower numbers often indicate that prices have recovered enough to reduce the proportion of underwater investors (i.e. loss-making investors).
However, on-chain indicators are rarely used alone. Analysts often combine unrealized loss data with exchange flows, long-term holder behavior, realized losses and derivatives holdings to build a more comprehensive picture of market conditions.
For now, Bitcoin appears to have emerged from the deep pressure zone that emerged at the end of June. While this suggests an improvement in market sentiment, the indicator is still above the long-term comfort zone, which means investors may continue to focus on whether the indicator stabilizes below 40%, or will climb again when the market weakens again.






















