Exchange Ranking
 Top Exchanges
 24h Volume Ranking
 Popularity Ranking
 Exchange BTC Balance
 Proof of Reserves
 Decentralized Exchanges
 Funding Rate
 Funding Heatmap
 Liquidation Data
 Max Pain
 Long/Short Ratio
 Whale L/S Ratio
 Binance/Okex/Huobi L/S
 Bitfinex Margin L/S
 ETF Tracker
 Solana ETF
 XRP ETF
 Hong Kong ETF
 Bitcoin Treasuries
 Crypto Reversal
 Ethereum Reserves
 HyperLiquid Wallet Analysis
 Hyperliquid Whale Watch
 Large Transactions
 On-chain Movement
 Bitcoin ROI
 Stablecoin Market Cap
 Options Analysis
 News
News Articles
 Economic Calendar
 Features
 Wallet
 Contract Calculator


 Security
 Collections
 Watchlist
 Following
Today's Gold Price Forecast (September 4)
In our last daily gold forecast, we mentioned that if the price of gold breaks through US$4,450, it may open the door to US$4,600; while holding US$4,300 can maintain a bullish recovery. Gold did then move up the bullish path, rising more than 2% to approximately $4,491.55. This was mainly due to weak labor data, a weaker dollar and a decline in U.S. Treasury yields, which together reduced market expectations for the Federal Reserve to raise interest rates in September. In addition, Christopher Waller also said that if inflation continues to cool, he may support keeping interest rates unchanged. Currently, the price of gold is operating in the daily imbalance range of US$4,471 to US$4,564. The next question is: Can buyers regain the upper track, or will they be suppressed and fall back? Under the combined effect of these factors, where will gold prices go today?
The news that today may push gold prices
Wednesday's ADP data gave us a glimpse: the private sector added only 38,000 jobs in August, lower than the expected 47,000, the weakest performance since January this year.
In addition, the number of initial jobless claims per week was 206,000, slightly higher than the expected 205,000. Although the data is not alarming, it leaves room for policy easing.
Now, everyone's eyes are focused on the blockbuster data to be released today-the non-farm payrolls report. The market expects 55,000 new jobs, compared with-23,000 in the previous month (disastrous performance). Unemployment is expected to stabilize at 4.1%. Salary: The average hourly wage is expected to increase by 0.3% month-on-month, higher than the previous value of 0.1%.
If non-agricultural data is weak, the US dollar is likely to fall under pressure, and U.S. Treasury yields will also fall simultaneously. Once these two decline, gold usually gets a good boost.
Monetary and geopolitical factors are equally important. On Thursday, the U.S. dollar index fell about 0.4% as the yen strengthened and U.S. Treasury yields fell, easing upward pressure on gold. The U.S. -Iran conflict remains a two-way risk: Brent crude oil has exceeded $97, triggering inflation concerns, which may prompt the Fed to adopt a hawkish response; but President Trump said the U.S. strike on Iran may be short-term, reducing concerns about long-term oil shocks.
Related gold news
(Relevant article guidelines are hidden here)
What does the gold chart show?
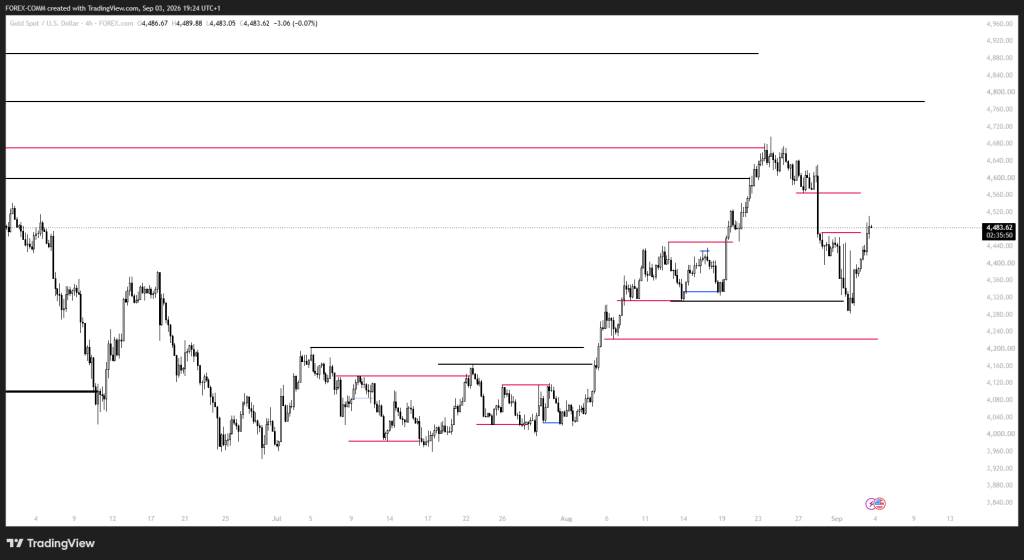
We looked at the chart and the overall structure remained bullish. Gold rebounded to $4,483.62 after reaching a weekly low around $4,311. From US$4,311 to current prices, the increase is about 4%, indicating strong demand at the lower edge of the recent range.
 (The source information is concealed here)
The current key area is the daily imbalance range of US$4,471 to US$4,564. Gold prices are operating within this range, and the region's response may determine the next major trend. The chart shows that gold prices had previously fallen below the $4,560 region to $4,311, and then rebounded back to the same region. If this is blocked, the seller will obtain clear technical basis.
If this imbalance range is exceeded, the next major reference level will be a weekly high of US$4,786.92, followed by US$4,899. The upward trend in the previous chart started from an August low and formed higher highs and higher lows, so if gold prices effectively break through $4,564, these above targets will come back into view.
Where will gold prices go today?
Bullish path:
If gold breaks through $4,564 and stabilizes, buyers are likely to target a weekly high of $4,786.92. If there is a further breakthrough, US$4,899 will be included in the horizon. From the current level of $4,483.62, this would be a 9.2% increase.
Bear path:
On the other hand, if the US$4,471 to US$4,564 area acts as resistance, sellers will regain the upper hand. They may push gold prices to $4,223; if they fall below that support, the next target will be $4,106. This is equivalent to an 8.4% drop from current prices.
Reference path:
Gold prices could fluctuate in the box between $4,471 and $4,564 until U.S. jobs data is released. As long as gold prices remain above $4,471, the recovery story remains supportive. However, if it fails to return above US$4,564, it is expected that the price of gold will first fall back to US$4,223 before it may see real upward thrust.
Frequently Asked Questions
What is the gold price forecast on September 4, 2026?
 If gold breaks through the daily imbalance range of $4,564, it may target $4,786.92 and $4,899. If this region constitutes resistance, US$4,223 and US$4,106 will become key downside targets.
Why did gold prices rise today?
Gold prices were supported by weak U.S. labor data, falling U.S. Treasury yields, a weakening U.S. dollar and lower expectations for the Federal Reserve to raise interest rates in September. The ADP report showed that only 38,000 jobs were added in August, down from the expected 47,000.
What U.S. economic data on September 4 may affect gold prices?
The main catalysts are changes in non-farm employment, unemployment rate and average hourly earnings. The market expects 55,000 new jobs, an unemployment rate of 4.1%, and a monthly salary increase of 0.3%. Weak-than-expected data could support gold prices by raising expectations for the Federal Reserve's easing policy, while stronger-than-expected data could support the dollar and weigh on gold.
(Hide YouTube channel subscriptions and article source information here)