Exchange Ranking
 Top Exchanges
 24h Volume Ranking
 Popularity Ranking
 Exchange BTC Balance
 Proof of Reserves
 Decentralized Exchanges
 Funding Rate
 Funding Heatmap
 Liquidation Data
 Max Pain
 Long/Short Ratio
 Whale L/S Ratio
 Binance/Okex/Huobi L/S
 Bitfinex Margin L/S
 ETF Tracker
 Solana ETF
 XRP ETF
 Hong Kong ETF
 Bitcoin Treasuries
 Crypto Reversal
 Ethereum Reserves
 HyperLiquid Wallet Analysis
 Hyperliquid Whale Watch
 Large Transactions
 On-chain Movement
 Bitcoin ROI
 Stablecoin Market Cap
 Options Analysis
 News
News Articles
 Economic Calendar
 Features
 Wallet
 Contract Calculator


 Security
 Collections
 Watchlist
 Following
 SUI
SUI SUI is still below the downtrend line, and US$0.70 support is becoming increasingly critical to the short-term direction.
The four-hour chart shows signs of potential rebound, but it is still necessary to confirm that prices stand above US$0.75 before stronger upward momentum can take shape. If it falls below US$0.70, it may test down the US$0.65 - 0.66 range; while continuing to break through US$0.85 will strengthen the rebound structure.
Markets are testing support after a sharp rally in August, with $0.70 being an important concern level because of suppressing resistance to a rebound above the region.
SUI comes under pressure after rebound in August
In an earlier post, Jesse Olson pointed to a buy signal appearing on SUI's four-hour chart. He compared the current structure to the bottom before a previous 40% gain. Subsequent follow-up showed that while the RSI and buy signals were brewing, there was a false downward breakthrough. 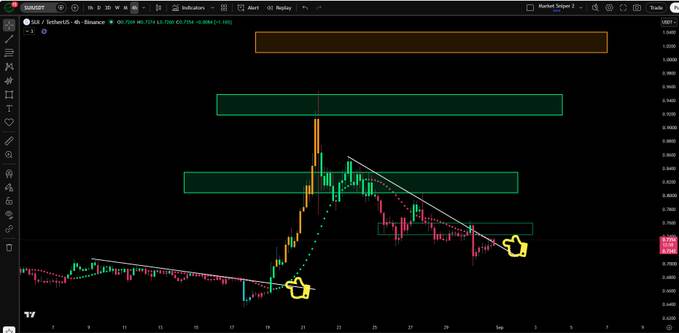
SUI daily quoted at US$0.7206, below its 9-day moving average. The price had previously jumped above $0.90, before sellers pressed the price back. Since then, the market has formed lower highs below a blue downtrend line.
This trend line remains the clearest short-term resistance for buyers. A 9-day moving average near $0.7504 provides additional upper resistance. Therefore, a continued rebound requires buyers to regain both areas.
The chart also shows resistance in the $0.775 and the $0.79 - 0.80 area. These levels correspond to multiple one-eye balance table readings. As a result, buyers face multiple technical obstacles before encountering higher resistance.
Support around US$0.70 becomes focus
The US$0.70 area is the first major support below current prices. Prices have recently experienced a considerable period of consolidation near the region. Holding that area will leave open the possibility of another rebound attempt.
A decisive break below US$0.70 will weaken the short-term structure. The next significant support area is around $0.65 - 0.66. The area had previously attracted buyers to intervene in earlier consolidations.
Volume provides additional context on recent price movements. The rebound in August was accompanied by a significant increase in trading activity. Subsequent declines were accompanied by relatively light volume over multiple trading sessions.
However, a decrease in volume alone does not confirm that the seller has exhausted its strength. Buyers need to show greater engagement when breaking through resistance. Without such confirmation, the rally remains vulnerable to new selling pressures.
Resistance determines the next step
The blue downtrend line connects a series of recent lower highs. Prices have yet to achieve a convincing breakthrough in this resistance. Therefore, as long as sellers remain in control of the situation, the short-term structure continues to be under pressure. 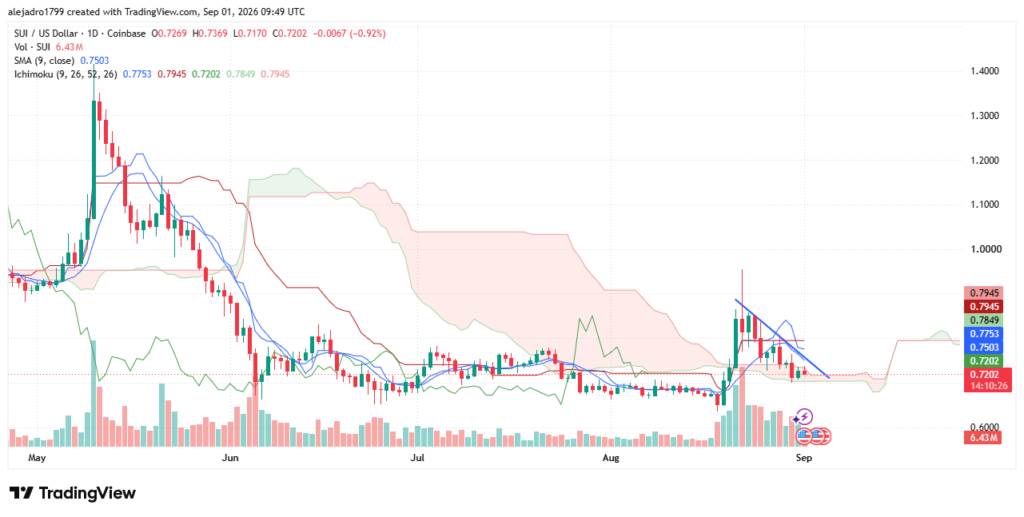
The Ichimochi balanced table form adds additional resistance in the rebound area. Multiple readings fell within the $0.75 - 0.80 range. Continued breakthroughs in the region will improve the short-term structure.
The US$0.85 region is another important rebound test point. Recovering this level would challenge the pattern of recent lower highs and provide stronger evidence of improvement in market structure.
For now, the chart presents a clear technical level rather than a confirmed reversal. Support is around $0.70, followed by the $0.65 - 0.66 region. The resistance range is currently US$0.75 to US$0.85, and traders need to pay close attention to the next key move.