Exchange Ranking
 Top Exchanges
 24h Volume Ranking
 Popularity Ranking
 Exchange BTC Balance
 Proof of Reserves
 Decentralized Exchanges
 Funding Rate
 Funding Heatmap
 Liquidation Data
 Max Pain
 Long/Short Ratio
 Whale L/S Ratio
 Binance/Okex/Huobi L/S
 Bitfinex Margin L/S
 ETF Tracker
 Solana ETF
 XRP ETF
 Hong Kong ETF
 Bitcoin Treasuries
 Crypto Reversal
 Ethereum Reserves
 HyperLiquid Wallet Analysis
 Hyperliquid Whale Watch
 Large Transactions
 On-chain Movement
 Bitcoin ROI
 Stablecoin Market Cap
 Options Analysis
 News
News Articles
 Economic Calendar
 Features
 Wallet
 Contract Calculator


 Security
 Collections
 Watchlist
 Following
 LINK
LINK 链连(LINK)价格预测与市场趋势分析
有一种图表形态能让交易者瞬间停止滑动屏幕,而链连(Chainlink)刚刚就呈现了这样的时刻。在经历数周的横盘震荡后,LINK 成功突破束缚,并以一种坚定的姿态向上攀升,引起了整个社区的广泛关注,也在社交媒体上引发了新一轮关于“链连价格预测”的讨论。大家最关心的问题是:这次上涨是否具有持久的生命力,还是仅仅是更大行情的前奏?
本文是对链连图表及当前市场条件的纯技术和数据驱动解读。这不代表个人持有 LINK 的立场,也不应被视为财务建议。
今日链连价格:LINK 价格预测与趋势数据
LINK 目前交易价格为 12.365 美元,过去 24 小时内上涨了 5.59%。过去一天的期货成交量为 5.594 亿美元,现货成交量为 1.3746 亿美元,这表明杠杆交易者正在推动这一走势的重要部分。市值为 92.4 亿美元,未平仓合约价值为 6.7556 亿美元,这是一个积极信号,表明新仓位正在积极建立,而非仅仅是在平仓现有仓位。
流通供应量、总供应量和最大供应量均显示为 7.4809 亿枚,占最大供应量 10 亿枚的 74.8%。这意味着随着时间的推移,仍有相当数量的 LINK 将进入流通领域。
来源:CoinGlass,2026年9月19日。
最新链连新闻:LINK 价格预测热议
今天的链连新闻周期并非由官方公告主导,而是由社区能量塑造。
X 平台上广泛传播的一篇来自 Albie 的帖子展示了一张链连代币价格卡片,显示 LINK 价格为 12.36 美元,上涨 8.43%,并配有一张长期图表,上面有一个大胆的箭头指向 2027 年至 2033 年间的某个时间点,目标价位约为 300 美元。必须明确指出,这是一个投机性的、由社区驱动的长期目标,而非任何机构的确认预测,但它捕捉到了此次突破后围绕 LINK 变得多么乐观的情绪。此类帖子往往能迅速放大散户兴趣,结合实际价格走势,显然为本周更广泛的 LINK 价格预测对话增添了燃料。
快速概览
- CMP(当前市场价格): Binance LINK/USDT 永续合约 4小时图上的价格为 12.371。
- 看涨触发条件: 4小时收盘价高于 13.686 将打开通往 15.000 和 20.220 的路径。
- 看跌触发条件: 4小时收盘价低于 10.630 将焦点转向 9.319。
- 数据时间戳: 图表和市场数据截至 2026年9月19日 11:25 IST。
- 风险提示:The increase in open interest contracts accompanying price increases means that if leveraged positions are squeezed, sharp long-shadow fluctuations can occur.
Link Technical Analysis: LINK Price Target Outlook
Open the 4-hour link chart on Binance, whose structure tells a fascinating story.
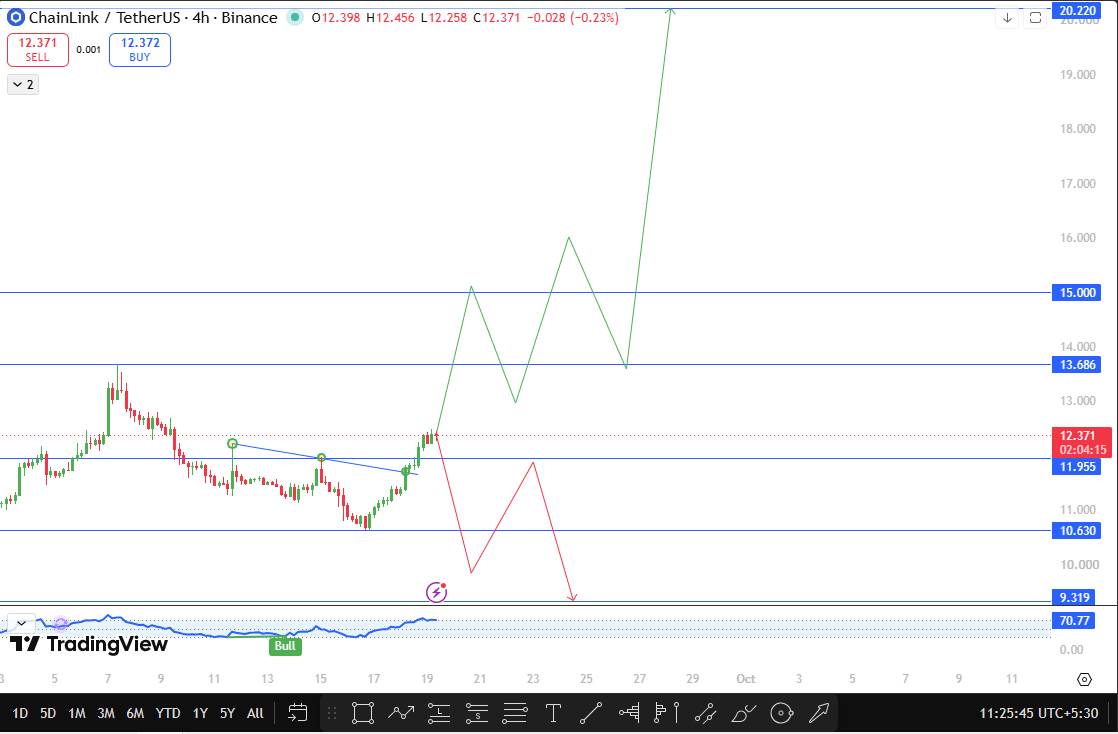 $LINK has been consolidating below the downtrend line for some time, gathering energy as markets often do before real action. That trend line was finally broken, and prices did not fall back like many breakthroughs, but continued to climb, clearing the previous flip zone of nearly 11.955 and transforming once resistance into a support platform below current price behavior. This clean level flip is one of the strong signs that breakthroughs have real follow-up momentum rather than temporary pulses. The momentum picture also supports this. The oscillator on the chart carries a marked "bullish signal" reading close to 70.77, reflecting strong potential momentum but has not yet issued a warning of exhaustion. The current price is at 12.371, and the next real test is 13.686. This level is important because it represents the next important supply area on the chart, and a four-hour closing above it will basically confirm that buyers are willing to continue to push through resistance rather than just testing it.
如果 $LINK 确实实现了 13.686 上方的收盘,大门将通向 15.000,这是一个心理层面的重要整数关口,通常作为动量交易者的自然目标。除此之外,更具雄心的“链连价格预测”目标位于 20.220,这一水平将代表当前走势的大幅延伸,可能需要持续几个交易时段的买入兴趣,而非单一的冲高爆发。
在这一 setups 的另一端,10.630 是保持整个看涨结构完整的水平。只要 LINK 保持在它之上,突破叙事就仍然有效。4小时收盘价低于该水平将表明该走势失去了基础强度,从那里开始,买家可倚靠的下一个逻辑支撑位将是 9.319。
支撑与阻力水平
水平类型 价格 距离 CMP (12.371) 阻力 3 20.220 +63.4% 阻力 2 15.000 +21.3% 阻力 1 13.686 +10.6% 当前价格 12.371 — 支撑 1 (前阻力) 11.955 -3.4% 支撑 2 10.630 -14.1% 支撑 3 9.319 -24.7% 看涨、基准与看跌情景
看涨路径: LINK 坚守在被重新收回的 11.955 水平之上,并在 4小时收盘中突破 13.686。这种确认可能会吸引一直在一旁观望的动量交易者,从那里 15.000 成为一个现实的短期目标,而 20.220 则作为那些愿意忍受途中波动的投资者的奖励,位于更远的位置。
基准案例:这也是 arguably 最可能的近期结果,LINK 将在 11.955 支撑位和 13.686 阻力平台之间花费一些时间进行盘整。在如此剧烈的运动之后,消化期是完全正常的,这将让市场吸收技术突破及其产生的社交关注浪潮,然后再 commitment 到下一段行情。
看跌场景: 涉及 LINK 失去最近收回的 11.955 支撑位,并最终在 4小时收盘中跌破 10.630。这将是语气的一个重大转变,表明突破比预期更快地耗尽动能,卖家可能会瞄准 9.319 支撑区。
长期展望 2027-2033
如果链连的采用率、网络效用和更广泛的加密货币市场增长继续扩大,$LINK 在长期内有可能达到 $300。然而,$300 是一个投机的长期情景,而不是保证的价格目标。短期技术层面不应被解释为 LINK 将达到 $300 的预测。本报告仅供信息参考,不构成财务建议。
需关注的风险
The rise in open interest as prices rise is usually a sign of health, but it also means that more leveraged positions are at risk of liquidation if momentum suddenly stagnates. Community-driven price targets, such as long-term forecasts circulating on social media, can quickly boost sentiment, and any pullback after that hype may feel more drastic than previous trends. The broader crypto market environment is also an external factor, as even the technically powerful LINK setup can be disrupted by sudden shifts in risk appetite elsewhere.
Glossary
Flip zone: A price level that previously acted as a resistance, once it breaks through, begins to act as a support, and vice versa.
4h close: The final price of an asset traded before the end of the 4-hour candle chart, often used to confirm intraday breakthroughs.
Open interest: The total number of derivative contracts still outstanding, indicating active leverage positioning in the market.
Momentum oscillator: A technical indicator used to measure the speed and intensity of recent price changes to determine whether a trend is gaining or losing power.
Disclaimer
This document is for information purposes only and does not constitute financial advice. The cryptocurrency market is extremely volatile and readers should study it for themselves before making any investment decisions.