Exchange Ranking
 Top Exchanges
 24h Volume Ranking
 Popularity Ranking
 Exchange BTC Balance
 Proof of Reserves
 Decentralized Exchanges
 Funding Rate
 Funding Heatmap
 Liquidation Data
 Max Pain
 Long/Short Ratio
 Whale L/S Ratio
 Binance/Okex/Huobi L/S
 Bitfinex Margin L/S
 ETF Tracker
 Solana ETF
 XRP ETF
 Hong Kong ETF
 Bitcoin Treasuries
 Crypto Reversal
 Ethereum Reserves
 HyperLiquid Wallet Analysis
 Hyperliquid Whale Watch
 Large Transactions
 On-chain Movement
 Bitcoin ROI
 Stablecoin Market Cap
 Options Analysis
 News
News Articles
 Economic Calendar
 Features
 Wallet
 Contract Calculator


 Security
 Collections
 Watchlist
 Following
 IMX
IMX IMX breaks through downtrend line, buyers quickly return
IMX breaks through its downtrend line with a strong green candle, and buyers are quickly re-entering. This report analyzes the market in September 2026: the bullish trend remains intact above US$0.12720. If the closing price stabilizes above US$0.13437, it may open up room for further gains.
Market data check time: August 27, 2026, 13:47 Indian Standard Time.
Immutable September 2026 Price Forecast: Market Overview
Indicator : Value
Price: US$0.13216
24-hour Change: +4%
Market Value: US$264.23 million
Unlock Market Value: US$264.23 million
Fully diluted market value (FDV): US$264.23 million
24-hour trading volume: US$9.38 million
Trading volume/market value (24-hour): 3.57%
Total supply: 2 billion
Maximum supply: 2 billion
Circulation supply: 2 billion
Number of holders: 98,520 people
Data source: Data comes from market data at 13:47 IST on August 27, 2026. Data may vary slightly from tracking website to website.
Technical Analysis: Key Support and Resistance Levels for September 2026
Trading Pair : IMX/USDT · Market : Spot (cryptocurrency)· Time Frame : Daily Line· Data Timestamp : August 27, 2026 13:47 UTC+5:30
IMX strongly broke through its months-long downtrend line in late August, rebounded from the $0.10 region and is currently consolidating around $0.132. The 9-day exponential moving average (EMA 9) is at $0.12502, below current prices, keeping the short-term structure bullish. The Relative Strength Index (RSI 14) read 64.65 and the signal line is 50.14, showing real upward momentum but has not yet entered severely overbought territory.
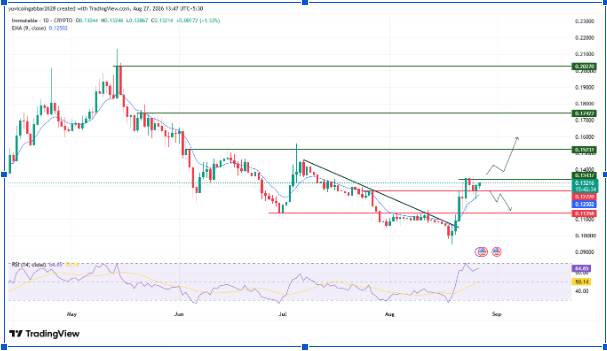
Support and resistance
Resistance 4: US$0.20270
Resistance 3: US$0.17422
Resistance 2: US$0.15231
Resistance 1 (recent): US$0.13437
Current reference price : US$0.13216
First confirmed support : US$0.12720
Structure bottom : US$0.11358
September 2026 forecast: bullish, neutral and bearish scenarios
bullish scenario : If the closing price stands above US$0.13437, as long as momentum continues, the price is expected to move towards US$0.15231 or even US$0.17422.
Neutral scenario : IMX may consolidate between US$0.12720 and US$0.13437 in September to absorb the impact of a breakout of the trend line.
Bear scenario : A loss of US$0.12720 would call into question the validity of the breakthrough and the price could drop to the bottom of the structure near US$0.11358.
IMX September 2026 Price Scenario: Key Points to Know
Scenario : Trigger conditions : Possible outcomes : Expiration conditions
Breakout extension (bullish): Close above US$0.13437: Move towards US$0.15231, then US$0.17422: Closing price fell back below US$0.12867
Step back confirmed: The correction gained support above US$0.12720: Prices stabilized, tried again to challenge US$0.13437: Falling below US$0.12720
Range fluctuations: between US$0.12720 and US$0.13437: Horizontal consolidation: Break through either boundary
Trend collapse (bearish): Close below US$0.12720: Fall to US$0.11358: Reclaim US$0.12720
Key factor that may affect prices in September (Immutable)
Volume rose in line with prices, a healthier signal than a rise when interest fades. Immutable's focus on the gaming and NFT Layer 2 network space means that broader gaming token market sentiment could add momentum to it in either direction. No specific verified news events are cited here.
Can IMX reach US$0.20270 in September 2026?
US$0.20270 is the highest resistance level on the chart. To reach this level, IMX needs to exceed US$0.13437, US$0.15231 and US$0.17422 in turn. This is a multi-stage rising process that requires continued volume support.
Immutable September 2026 Price Forecast: Expert Views
Analysts believe that trend-line breakthroughs and rising RSI indicators are currently favorable to buyers. The US$0.12720 to US$0.13437 region will determine the trend in September: holding on to this region will continue the recovery; failure to rule indicates that previous breakthroughs are a false signal.
Immutable September 2026 price forecast: Data source
Price, EMA and RSI data are from IMX/USDT daily charts with a timestamp of August 27, 2026 at 13:47 UTC+5:30. Market capitalization, fully diluted valuations, trading volume and supply data come from platforms such as CoinGecko.
This article is for reference only and does not constitute financial advice. The cryptocurrency market is highly volatile, and past performance does not guarantee future results. Research for yourself before taking action based on any price points discussed in this article.