
 Exchange Ranking
 Top Exchanges
 24h Volume Ranking
 Popularity Ranking
 Exchange BTC Balance
 Proof of Reserves
 Decentralized Exchanges
 Funding Rate
 Funding Heatmap
 Liquidation Data
 Max Pain
 Long/Short Ratio
 Whale L/S Ratio
 Binance/Okex/Huobi L/S
 Bitfinex Margin L/S
 ETF Tracker
 Solana ETF
 XRP ETF
 Hong Kong ETF
 Bitcoin Treasuries
 Crypto Reversal
 Ethereum Reserves
 HyperLiquid Wallet Analysis
 Hyperliquid Whale Watch
 Large Transactions
 On-chain Movement
 Bitcoin ROI
 Stablecoin Market Cap
 Options Analysis
 News
News Articles
 Economic Calendar
 Features
 Wallet
 Contract Calculator


 Security
 Collections
 Watchlist
 Following
 BTC
BTC  ETH
ETH  LINK
LINK LINK is trading at $8.243, and there are moves on the chart that have not been seen in weeks.
The same area that has shut out prices five consecutive times has now been regained. At the same time, an uptrend line is quietly converging with the region at the same location. This kind of double confirmation signal is not common, but once it appears, it often indicates a clear direction for the next move. This Chainlink price forecast will analyze the meaning of this signal, the critical level, and what circumstances may invalidate this bullish structure.
Chainlink Current Price
Indicator: Price
Value: 8.243 USD
24-hour change: +0.82%(+0.06703 US $)
Market Value: US$6.16 billion
Futures Volume (24 hours): US$254 million
Spot Volume (24 hours): US$38.01 million
Open interest: US$443.29 million
Circulation supply: 748.09 million LINK
Total supply: 1 billion LINK
Maximum supply: 1 billion LINK
Data source: CoinGlass, as of July 18, 2026
Market Background: How Bitcoin and Ethereum affect current trends
Chainlink does not fluctuate in isolation, so it is also helpful to understand what is happening in Bitcoin and Ethereum. Bitcoin is currently trading at close to US$63,913.53, up about 1.64% in the past day; Ethereum is trading at close to US$1,843.16, up about 0.75%. Both are on the rise today, although the overall market sentiment has not yet fully recovered. According to CoinMarketCap data, as of July 18, 2026, the Cryptocurrency Fear and Greed Index is 34, still in the "fear" range.
It is this mismatch that makes LINK's trend worthy of attention. Market sentiment has not yet turned positive, but the two major currencies have quietly climbed, and Chainlink has closely followed suit, regaining key resistance areas. When price movements precede sentiment, it often means that buyers are seizing the lead, rather than just chasing hype after the fact.
Chainlink Liquidation Data (July 18, 2026)
According to CoinGlass data, LINK's liquidation situation is biased towards long positions in short time frames and towards short positions in longer time windows. In the past hour, a total of US$185.44 was liquidated, all from long positions and no liquidation for short positions. 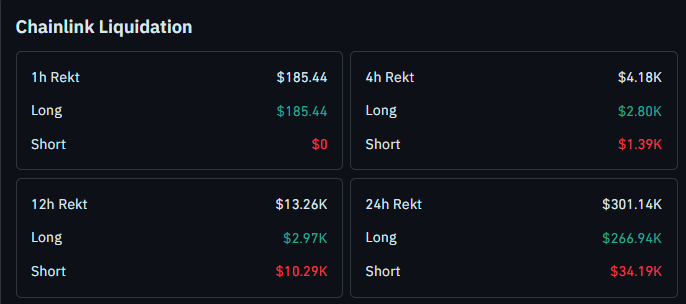
During the 4-hour window, the total clearing amount was US$4180, of which US$2800 was for long positions and US$1390 was for short positions. Within 12 hours, the total liquidation amount rose to US$13,260, with US$2970 for long positions and US$10,290 for short positions. 24 hours a day, the total liquidation amount was $301,140, with long positions accounting for $266,940 and short positions accounting for $34,190.
Long liquidations accounted for a larger proportion throughout the day, consistent with the earlier volatile market near the flip zone; while the recent increase in short liquidations shows that when LINK successfully held its position, the bears were caught off guard.
Why are Chainlink prices rising today?
Several positive factors for LINK are converging at the same time:
The flip zone has been regained: After five failed attempts, LINK finally broke through and closed above the US$8.099 to US$8.137 range, turning previous resistance into new support.
Trend Lines Crossing: An uptrend line built from recent higher lows is reaching the same price region almost exactly, reinforcing the level in another way.
Short clearing: CoinGlass data shows that short positions have begun to lose money in the past few hours as prices have refused to fall, and the closing of these positions often brings additional upward pressure.
ETF capital inflow activity: As of July 17, 2026, the cumulative net inflow of LINK spot ETF products was US$125,150, including the outstanding weekly net inflow of US$915,200 in the week of July 2, indicating that institutional interest persisted although uneven.
Chainlink Price Forecast: Chart Analysis (Short-term Outlook)
Method description: This analysis is based on the 1-hour LINK/USDT chart on TradingView, combining the price structure and RSI for momentum confirmation. Only when the confirmed candle closing price exceeds the specified trigger level is the level considered invalid and intraday hatching is not taken into account.
The US$8.099 to 8.137 range on the LINK chart is a typical flip area, with levels repeatedly switching between support and resistance. 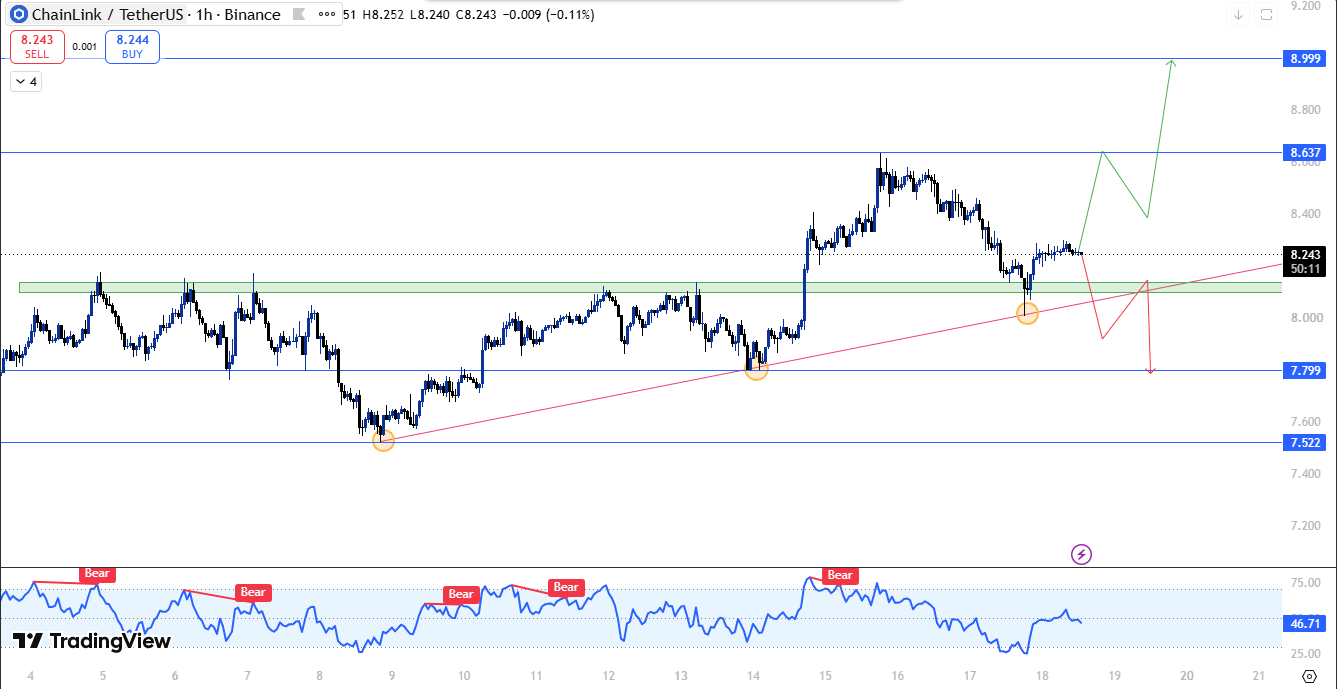 Prices have tested the area five times in the past few weeks as resistance, each time being rejected. Then, with a sudden burst of kinetic energy, LINK finally broke through in one fell swoop.
What is special about the current trend lies in its subsequent development. Unlike the previous one, which fell back and lost this level after every test, LINK successfully held on after falling back from above and touching the same flip area. The region is currently serving as a new level of support.
Further reinforcing this judgment is an uptrend line-a straight upward line connecting a series of higher lows that has been providing support for price increases. Currently, this trend line coincides with the flip area at almost the same position. This double confirmation-where the horizontal support area meets the trend line at the same price point-is uncommon, but once it occurs, it tends to attract more buyers looking for a clear entry point.
It is worth noting that the last time prices hit this trend line, the reaction was very strong. After hitting it for the second time, LINK rebounded sharply, recovering from a low area of around $7 to a recent high of around $8.637. This reaction suggests real buying interest along this trend line.
In terms of momentum, the RSI currently reads at 46.71, showing a moderate recovery after encountering a final rejection near recent highs and hitting bearish territory. Although it has not yet entered strong bullish territory, it has rebounded from recent lows, which is consistent with the judgment that the pressure is easing rather than intensifying.
If LINK continues to hold above the US$8.099 to US$8.137 range, the next resistance level to watch out for is US$8.637, followed by US$8.999. On the other hand, if the area fails to hold and prices close below $7.799, it will break the current bullish structure and open the door to the next support level of $7.522.
Chainlink Technical Overview
Signals: Trend
Indicators: Bullish (Above the flip zone)
RSI: 46.71, recovering
Structure: flip zone is regained + trend lines meet
Liquidation: Shorts are squeezed in a shorter time frame
ETF flow: Cumulative net inflow is positive
$LINK Support and Resistance
Type: Resistance 2
Level: US$8.999
Remarks: Next major upside target
Type: Resistance level 1
Level: US$8.637
Notes: Direct resistance level
Type: Current price
Level: US$8.243
Notes: Trading above the flip zone
Type: flip zone/Support level 1
Level: US$8.099 - 8.137
Notes: Regain
Type: Support level 2
Level: US$7.799
Remarks: Confirmation of closing price below this level triggers invalidation
Type: Support level 3
Level: US$7.522
Remarks: Deeper downside support
Risk-reward table
Scenario: Bullish case
Trigger conditions: Hold the US$8.099 to US$8.137 flip zone, trend line well supported
Target: Move to US$8.637 and US$8.999
Scenario: Bear Case
Trigger: Confirm closing below US$7.799
Target: Slide towards US$7.522
Failure Level
For LINK's bullish view to continue, the $8.099 to $8.137 flip zone needs to be held and the uptrend line below it needs to remain intact. If LINK closes below $7.799 on the 1-hour chart, the structure is completely broken and the next focus will shift to the downside target of $7.522.
Historical background
The reason why this trend is worth paying attention to is that this is the first time LINK has truly successfully held above the flip area after five consecutive failures. Every previous attempt ended the same way: prices broke briefly and were quickly pushed back. The fact that it has not been repeated this time suggests that dominance of the trend may have changed hands.
Chainlink Glossary
Flip zone: A price zone that constantly switches roles, sometimes acting as support and sometimes resistance, depending on where prices come from.
RSI (Relative Strength Index): A simple indicator used to show whether an asset is moving too fast in a certain direction, helping traders determine whether overbought or oversold may occur.
Open interest: The total value of outstanding derivative positions (such as futures).
Clearing: What happens when a leveraged trade is forced to close due to insufficient margin from the trader.
Uptrend line: A straight line drawn along a series of rising lows, often used to track the area where buyers continue to enter.
Fear and Greed Index: A daily indicator of whether cryptocurrency trader sentiment is fear or greed based on price volatility, volume and overall market sentiment.
Expert opinion
Chainlink's return to the US$8.099 to US$8.137 region is far more significant than any previous attempt. The reason is simple: prices have failed here many times before. In addition, an uptrend line is located almost exactly where the flip area is, and it is not uncommon for two independent signals to align in this way at the same location. Once it appears, it usually attracts more buyers seeking a clearer entry point. Coupled with the recent squeeze in short positions and the net positive flow of LINK's ETF funds, the short-term outlook tends that as long as the region continues to hold, prices are expected to test upwards of $8.637 and may even hit $8.999. However, if LINK finally closes below $7.799, it will be the clearest signal that the structure is failing.
Disclaimer : This document is for information purposes only and does not constitute any financial advice. The cryptocurrency market is highly volatile and price forecasts cannot be guaranteed. Before making any investment decisions, please conduct your own full research.






















